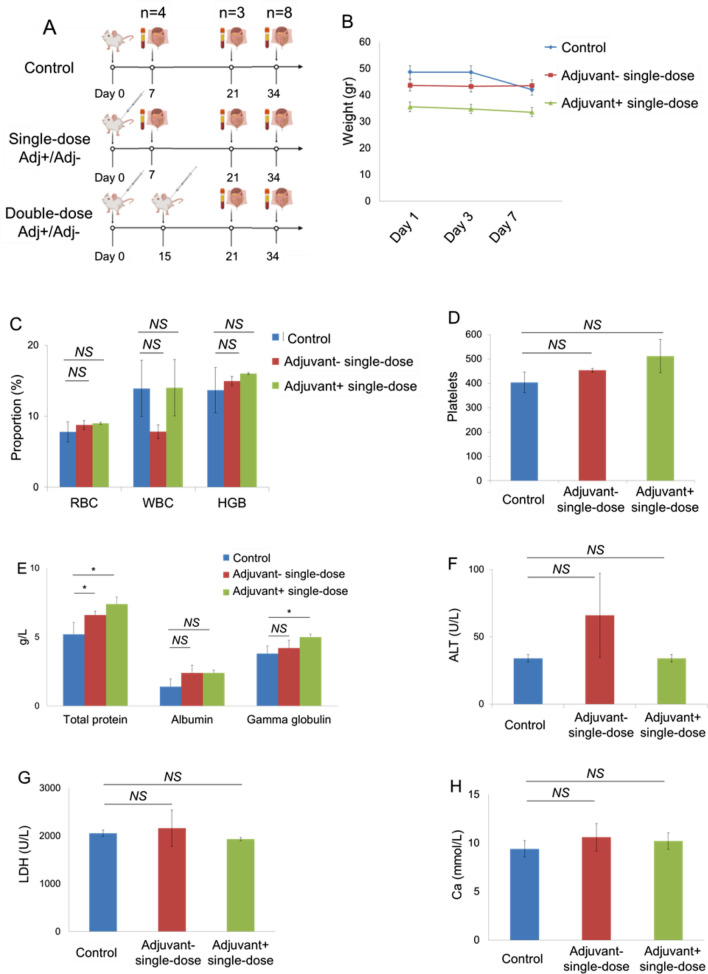
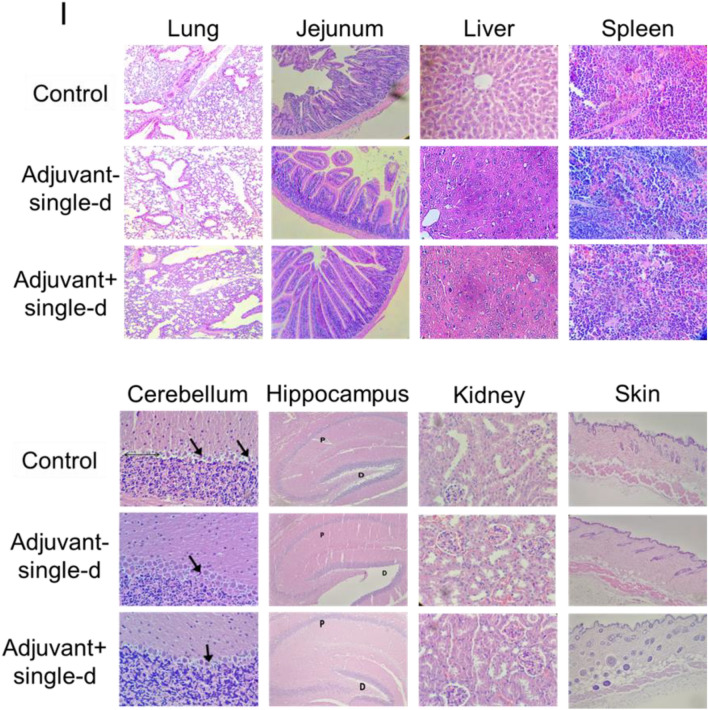
Figure 5.
Day-7 Safety analysis of the vaccine candidates, SK-01 V1, and OZG-3861 V1. (A) In vivo inactivated vaccine candidate treatments and euthanizations. Experimental plan of in vivo SK-01 V1 and OZG-3861 V1 intradermal treatment as single or double dose. (B) Graph showing weight change during one week in groups; control, blue; adjuvant negative single-dose (OZG-3861 V1), red; adjuvant positive single-dose (SK-01 V1), green. (C) Bar graph showing hemogram analysis including RBC, WBC, and HGB levels in the groups. (D) Bar graph showing the change in platelet proportions between groups in one week. (E) Bar graph showing levels of total blood protein, albumin, and gamma-globulin (g/L) in the groups. Bar graphs showing levels of (F) ALT (U/L), (G) LDH (U/L) and (H) Ca (mmol/L) in the blood of mice groups. (I) Histopathologic analysis on day 7 of the lung, jejunum of intestine, liver, spleen, cerebellum, hippocampus, kidney, and skin. Purkinje neurons (arrow). The thin double-headed arrow is space, the thick arrow is a picnotic cell.


