Figure 7.
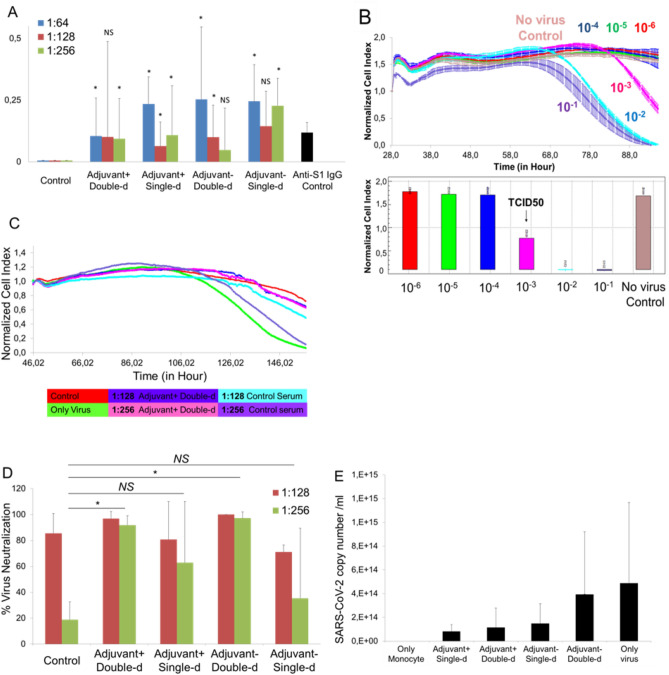
Pre-clinical efficacy study of vaccine candidates, SK-01 V1, and OZG-3861 V1. (A) Bar graph showing SARS-CoV-2 specific IgG analysis of the groups concerning the positive control antibody, mouse SARS-CoV-2 Spike S1 monoclonal antibody using ELISA. (B) Upper graph showing RTCA analysis of infective active SARS-CoV-2 in a dose-dependent manner for 6 days. Bar graph showing quantified normalized cell index values of SARS-CoV-2 titrations to determine TCID50 dose. (C) Representative RTCA graph of neutralization assay in which 1:128 and 1:256 dilutions of adjuvant positive double-dose (SK-01 V1) and control mice serum preincubated with 100 × TCID50 dose of SARS-CoV-2. (D) Bar graph showing quantified virus neutralization ratio of the vaccine treated groups at 1:128 and 1:256 dilutions. (E) Bar graph showing quantitated SARS-CoV-2 copy numbers when culturing on healthy adult monocytes along with 1:256 mice serum to determine Antibody-Dependent Enhancement (ADE). The threshold of significance for all tests was set at *p < 0.05. NS is Non-Significant.

