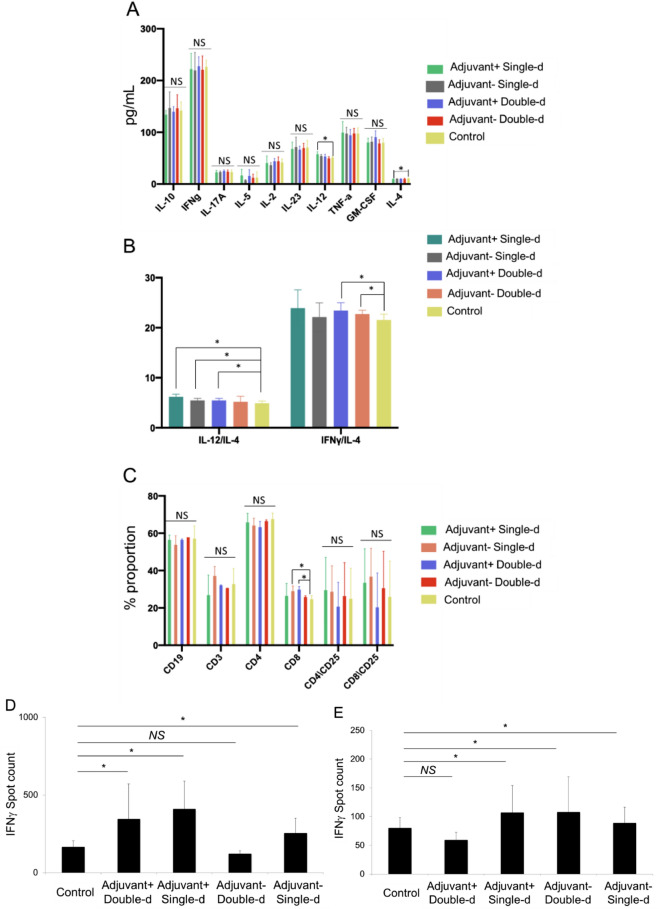
Figure 8.
Mouse spleen T cell response upon SARS-CoV-2 antigen. (A) Bar graphs showing quantitated mouse Th1, Th2, and Th17 specific cytokines (picogram/ml) secreted by the T cells isolated from dissected spleens on day 34 re-stimulated with SARS-CoV-2 specific S, N, and M-protein peptide pool. (B) Bar graphs showing the balance of Th1 and Th2 CD4 T cell response. The ratio of IL-12 to IL-4 or IFNg to IL-4 demonstrates Th1–dominant response. (C) Bar graph showing a change in the proportion of immune cell subtypes re-stimulated with the peptide pool (B cell, CD19 + ; T cell, CD3 + ; T helper cell, CD3 + CD4 + and cytotoxic T cell, CD3 + CD8 +). The activation marker of T cells is the upregulation of CD25. (D) Bar graph showing IFNγ spots formed during mouse spleen T cells isolated on day 21 incubated with whole inactive SARS-CoV-2 virus for 72 h. (E) Bar graph showing IFNγ spots formed during mouse spleen T cells isolated on day 34 incubated with SARS-CoV-2 specific S, N, and M-protein peptide pool for 72 h.

