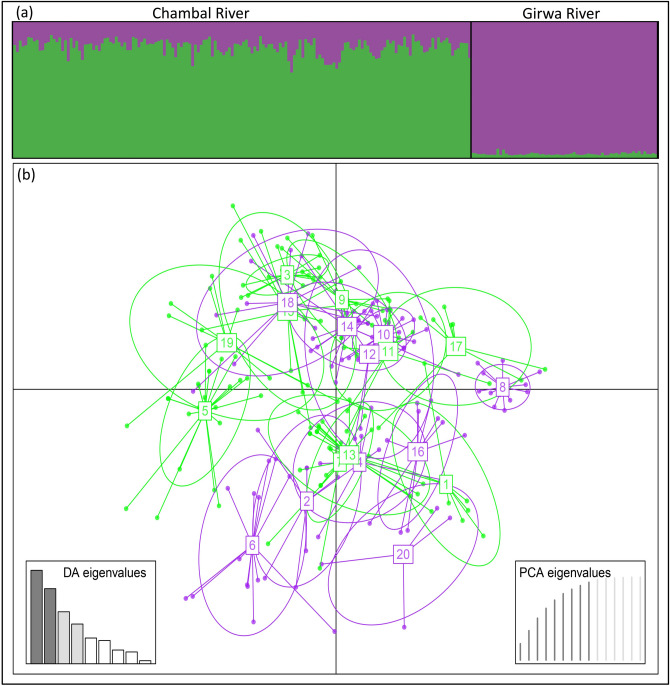
Figure 2.
(a) Population genetic structure of 228 gharial individuals derived using a Bayesian clustering approach implemented in STRUCTURE. A single bar plot represents the individual, and the extent of colour in each bar indicates the probability of assigning the individual to a particular cluster. (b) Scatterplot of the Discriminant Analysis of Principal Components (DAPC) of 228 gharial individuals. This scatterplot shows the first two principal components of the DAPC.

