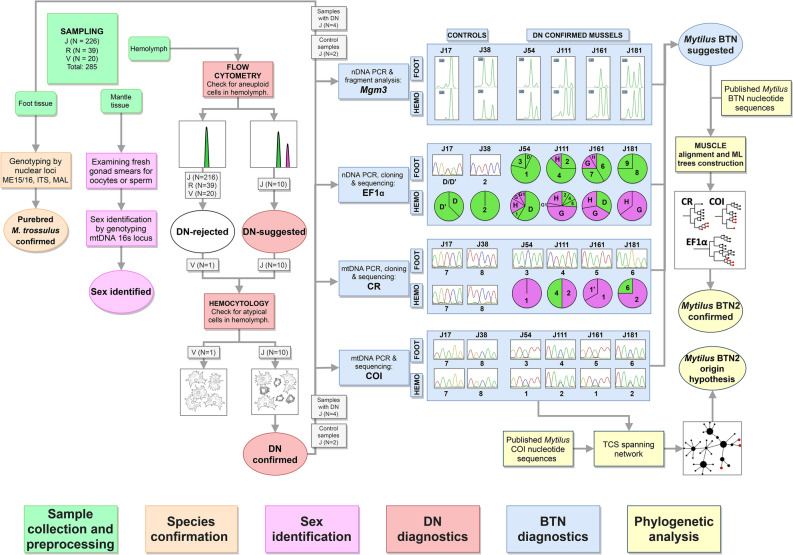
Figure 1.
Study design. Different steps of work are color-coded (see boxes at the bottom). Unique numbers of mussels used at different steps are given. Main results of the analyses are schematically outlined (see text). Real microsatellite electropherograms of Mgµ3 are shown. Sectors of pie charts are frequencies of sequences revealed by molecular cloning (sequences found in one or just a few colonies are not considered). Sequences are indicated by their unique names; supposedly cancerous alleles are shown in purple.

