
Figure 2.
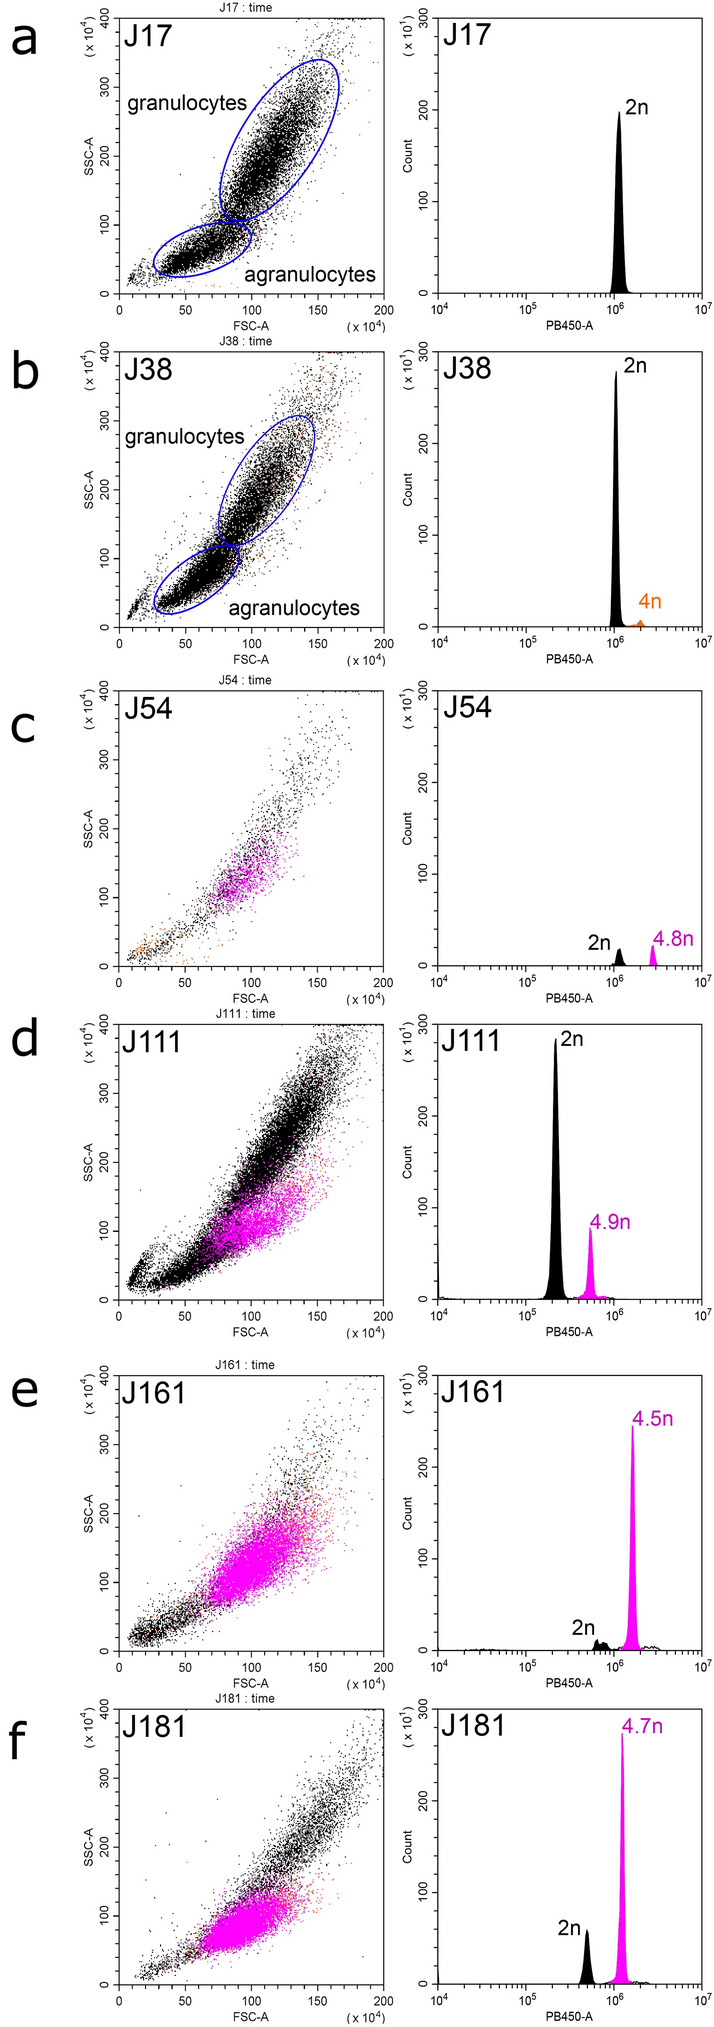
DN diagnostics in individual M. trossulus mussels from the Gaydamak Bay, the SOJ, by flow cytometry. Flow cytometry plots depict cell groups (left graphs) and histograms revealing ploidy levels (right graphs) for healthy (a,b) and DN-suggested (c–f) mussels. An additional population of aneuploid cells (violet peaks and dots) is observed in the hemolymph of each DN-suggested mussel. Normal non-proliferating hemocytes are shown in black, normal proliferating hemocytes (tetraploid), in orange. Relative ploidy levels are given near the peaks. Subpopulations of agranulocytes and granulocytes are highlighted for healthy mussels (a,b).