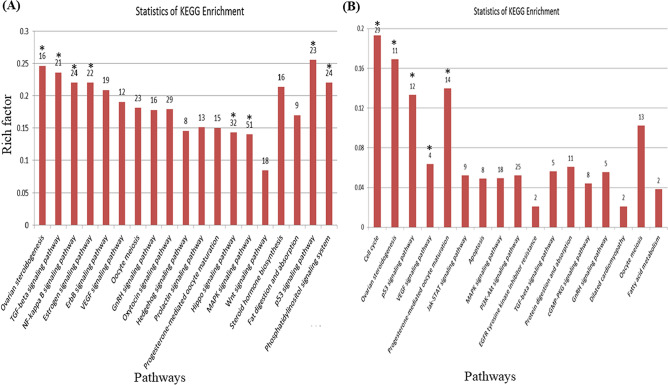
Figure 2.
KEGG pathway analysis of differentially expressed mRNAs in ovaries of Hu sheep at (A) H1 vs H3 and (B) H3 vs H8. H1, H3 and H8 represent ovaries sampled at 1, 3 and 8 months old, respectively. The x-axis represents the name of the pathway, and the y-axis represents the rich factor corresponding to each pathway (the number of differential mRNA enriched in each pathway/the number of all genes enriched in this pathway in the background gene concentration). The numbers on top of each bar represent the number of differential mRNA enriched in each pathway. Bars with * indicates those highly significant enriched with p value ≤ 0.001.

