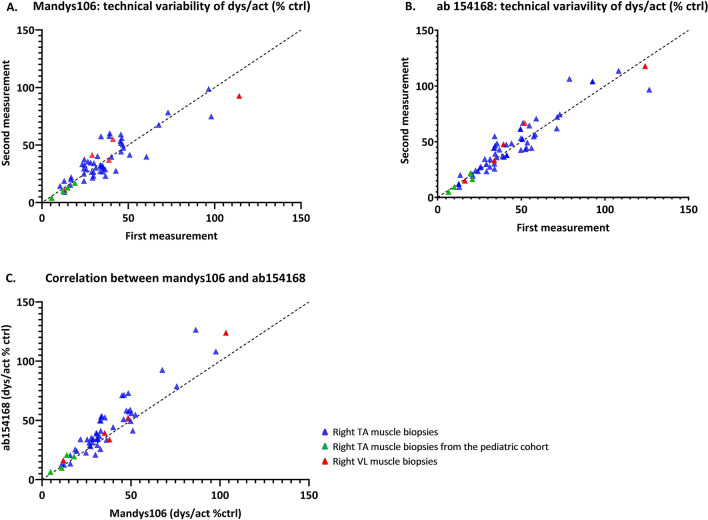
Figure 3.
Dystrophin levels quantified with Mandys106 and ab154168. (A) Scatter plot showing the correlation between dystrophin quantification in two technical replicates with Mandys106 (Pearson’s correlation = 0.897; p < 0.0001). (B) Scatter plot showing the correlation between dystrophin quantification in two technical replicates with ab154168 (Pearson’s correlation = 0.940; p < 0.001). (C) Scatter plot showing the correlation between dystrophin quantification with Mandys106 and ab154168 (Pearson’s correlation = 0.972; p < 0.0001).

