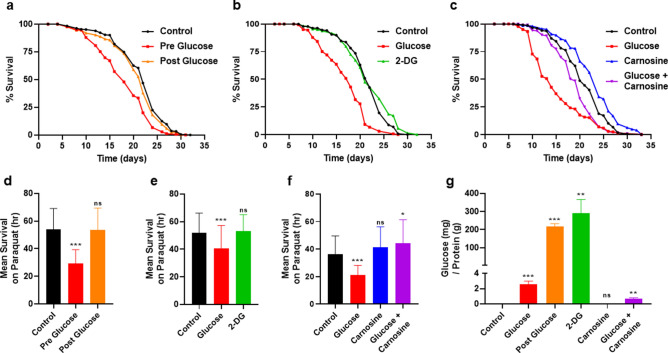
Figure 2.
Interfering with bacterial metabolism of glucose alters its effects on C. elegans. (a) Lifespan of wild type C. elegans consuming either 0% control, 0.4% glucose pre culture, or 0.4% glucose post culture OP50 E. coli, statistics in Supplementary Table S1, S2. (b) Lifespan of wild type C. elegans consuming either 0% control, 0.4% glucose fed, or 0.4% 2-deoxy-glucose (2-DG) fed OP50 E. coli, statistics in Supplementary Tables S1, S2. (c) Lifespan of wild type C. elegans consuming either 0% control, 0.4% glucose, 50 mM carnosine, or 0.4% glucose + 50 mM carnosine fed OP50 E. coli, statistics in Supplementary Tables S1, S2. (d) Oxidative stress resistance of wild type C. elegans consuming either 0% control, 0.4% glucose pre culture or 0.4% glucose post culture OP50 E. coli, measured by mean survival on paraquat, N = 570. (e) Oxidative stress resistance of wild type C. elegans consuming either 0% control, 0.4% glucose, or 0.4% 2-deoxy-glucose (2-DG) fed OP50 E. coli, measured by mean survival on paraquat media, N = 215. (f) Oxidative stress resistance of wild type C. elegans consuming either 0% control, 0.4% glucose, 50 mM carnosine, or 0.4% glucose + 50 mM carnosine fed OP50 E. coli, measured by mean survival on paraquat, N = 155. (g) Glucose assay of the OP50 E. coli bacterial diet in (a)–(f), results normalized to protein concentration. Statistical analysis of histograms compared C. elegans consuming 0% control with C. elegans consuming 0.4% glucose fed E. coli at the same time point using an unpaired two-tailed t test with GraphPad Prism 8.0 (https://www.graphpad.com). Symbols as follows: (ns = not significant, *P ≤ 0.05, **P ≤ 0.005, ***P ≤ 0.001). Data shown is a compilation from at least 3 biological replicates.

