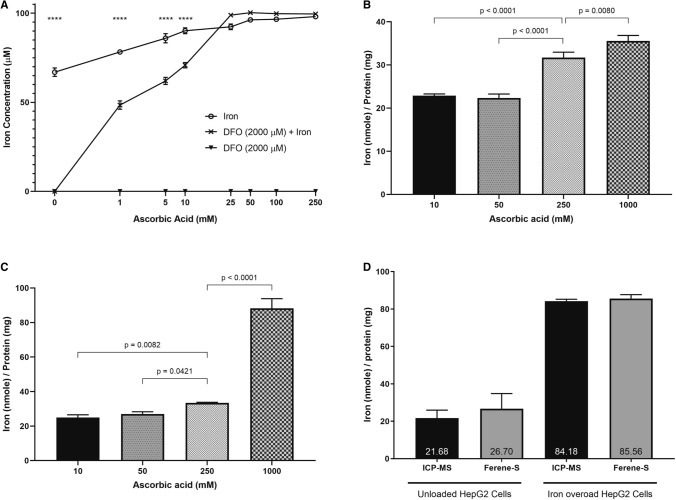
Figure 1.
The effect of changing the working solution’s ascorbic acid concentration on the measurement of ferene-chelatable iron. (A) Changes in OD 595 nm were measured for three analytes, 100 μM of iron, either free or pre-chelated with 2000 μM deferoxamine (DFO), when changing ascorbic acid. A concentration dependent increase in iron concentration was observed for iron pre-chelated with DFO. A two-way ANOVA was performed with Dunnett’s correction, using GraphPad Prism. **** represents p < 0.0001 (B) Labile iron pool, “LIP”, was quantified in iron overload HepG2 cell lysates. Ascorbic acid concentrations in the working solution were varied from 10 mM to 1 M. In LIP measurements, there was a significant increase in the detection of labile iron when using 250 mM (p < 0.0001) and 1 M (p = 0.0080). (C) Total iron was quantified in the same cell lysates after digestion with nitric acid. Ascorbic acid concentrations also varied from 10 mM to 1 M. In total iron measurements, there was a significant increase in iron concentration when using 250 mM (p = 0.0421) and 1 M (p < 0.0001) ascorbic acid. One-way ANOVA was performed with Dunnett’s correction using GraphPad Prism. (D) Total iron was quantified using both ICP-MS and the u-ferene (5 mM ferene and 1 M ascorbic acid) assay in unloaded and iron overloaded HepG2 cells. Similar results were obtained for both ICP-MS and the u-ferene assay; no significant difference is observed between either the control or the iron overload cells. All experiments were done in at least triplicates. Error bars show standard deviations. Statistical analyses were performed using GraphPad Prism.

