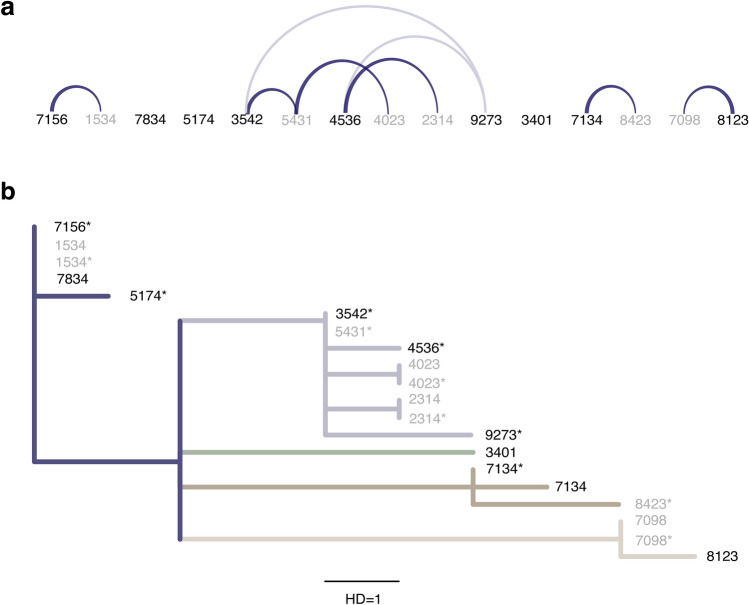
Figure 3.
Contact tracing record arc diagram (a) and maximum likelihood tree (b) of initial 15 cases prior to a church outbreak in South Korea. (a) Confirmed close contacts via epidemiological tracing are linked with a solid curve, with the transmission directionality (from case 8123 to case 7098, for example) indicated by width (wide: source; narrow: recipient). Potentially exposed pairs of individuals (within the same relative area) are marked with faded curves (for example, between Case 4536 and Case 9273). Imported (local) cases are presented by solid (faded) numbers. (b) Five transmission clusters inferred via maximum likelihood tree analysis on the SARS-CoV-2 whole genome sequences from the 15 cases: from top to bottom, cluster 1 (blue), cluster 2 (light blue), cluster 3 (green), cluster 4 (brown), cluster 5 (light brown). A star denotes sequences obtained by virus inoculation and cell culture. The length of the black bar indicates a Hamming distance (HD) of 1 or a one nucleotide base difference. The branch support values of the tree using the SH-like likelihood ratio test were estimated as around 1.

