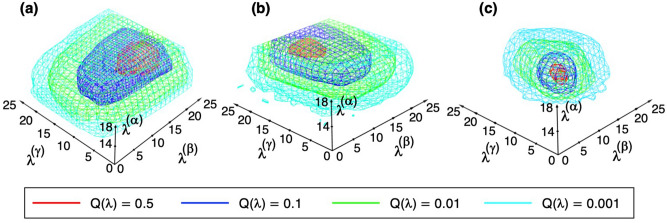
Figure 1.
Density of (a) the sertraline–mSin3B, (b) YN3–mSin3B, and (c) acitretin–mSin3B systems in the 3D-RC space. In GA-guided mD-VcMD, the distribution is defined originally by , where , and are respectively indices to specify the positions , , and in the 3D-RC space. Then, we convert to: , where (). See Supplementary Table S3 for values of , , and . Then, is normalized so that the highest density is set to 1. Contour levels are presented by colors in inset.

