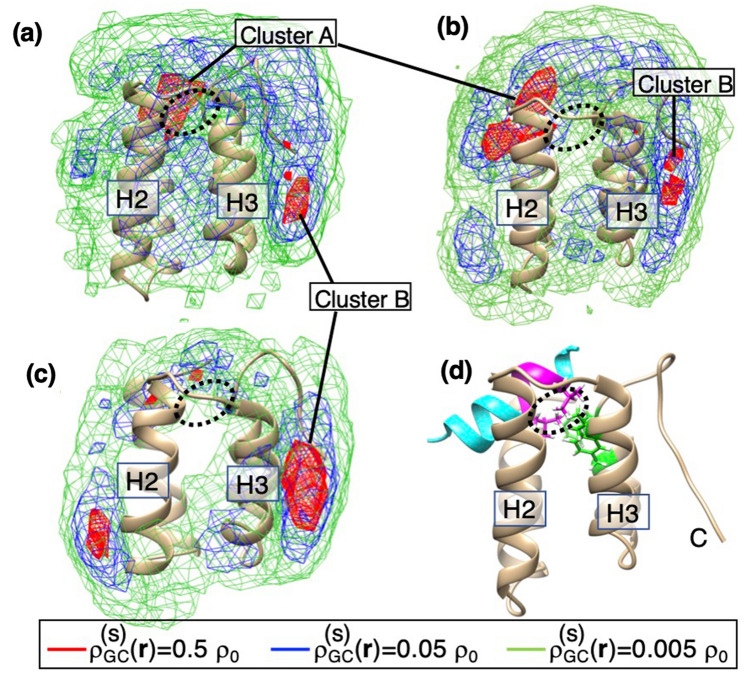
Figure 2.
Spatial density (s = sertraline, YN3, or acitretin) of the geometric center (GC) at position for (a) the sertraline–mSin3B, (b) YN3–mSin3B, and (c) acitretin–mSin3B systems in the 3D real space. See Supplementary Section 4 for procedure to calculate . Contour levels are shown in inset where . Displayed structure of mSin3B is that after NPT simulation for each system, where labels H2 and H3 represent helix 2 and helix 3 of mSi3B, respectively. The high-density cluster () in the cleft of mSin3B (PAH1) is named as Cluster A, and one near the N-terminal of mSin3B as Cluster B. (d) NMR structure of REST/NRSF-mSin3B complex (PDB ID: 2CZY), where cyan-colored model is REST/NRSF, and the magenta-colored segment is the LIML sequence of REST/NRSF. Label C indicates the position of the C-terminal tail of mSin3B. Two magenta-colored side-chains are Leu 46 and Leu 49 of the LIML sequence. Black broken-line circle indicates the position of the two sidechains. The circles in panels (a), (b), and (c) are presented to indicate the sidechain position of Leu 46 and Leu 49. Green-colored sidechains are Val 75, Phe 93, and Phe 96 of mSin3B (see also green-colored sidechains of Supplementary Figure S9a), which form a hydrophobic core with Leu 46 and Leu 49 of the LIML sequence.

