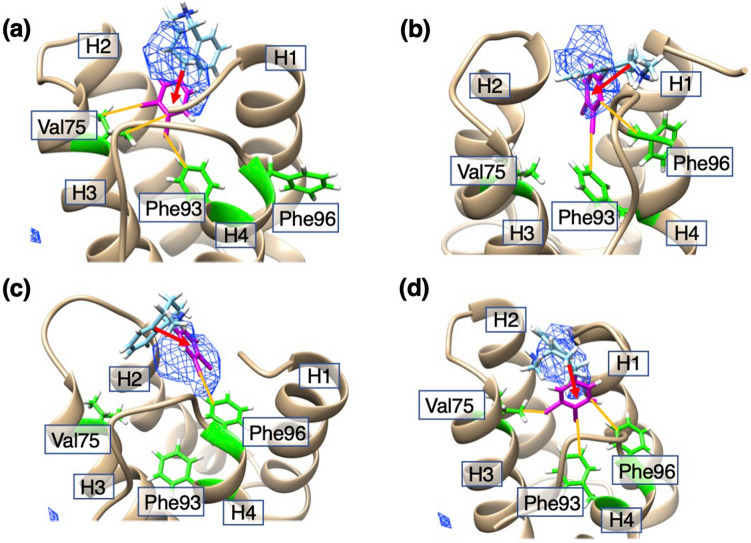
Figure 5.
(a)–(d) Sertraline–mSin3B complexes picked randomly from the high-density cluster (Cluster A) of (), which are shown by blue-colored contours. Magenta-colored portion is Ring A of sertraline. Red-colored arrows are those pointing from the Ring-BC geometrical center to that of Ring A (see Fig. 6a for positions of Ring A and BC). Green-colored residues are Val 75, Phe 93, and Phe 96 of mSin3B. Ocher-colored lines represent contacts between sertraline and the three residues. Labels H1,…, H4 are helices 1–4 of mSin3B (PAH1 domain).

