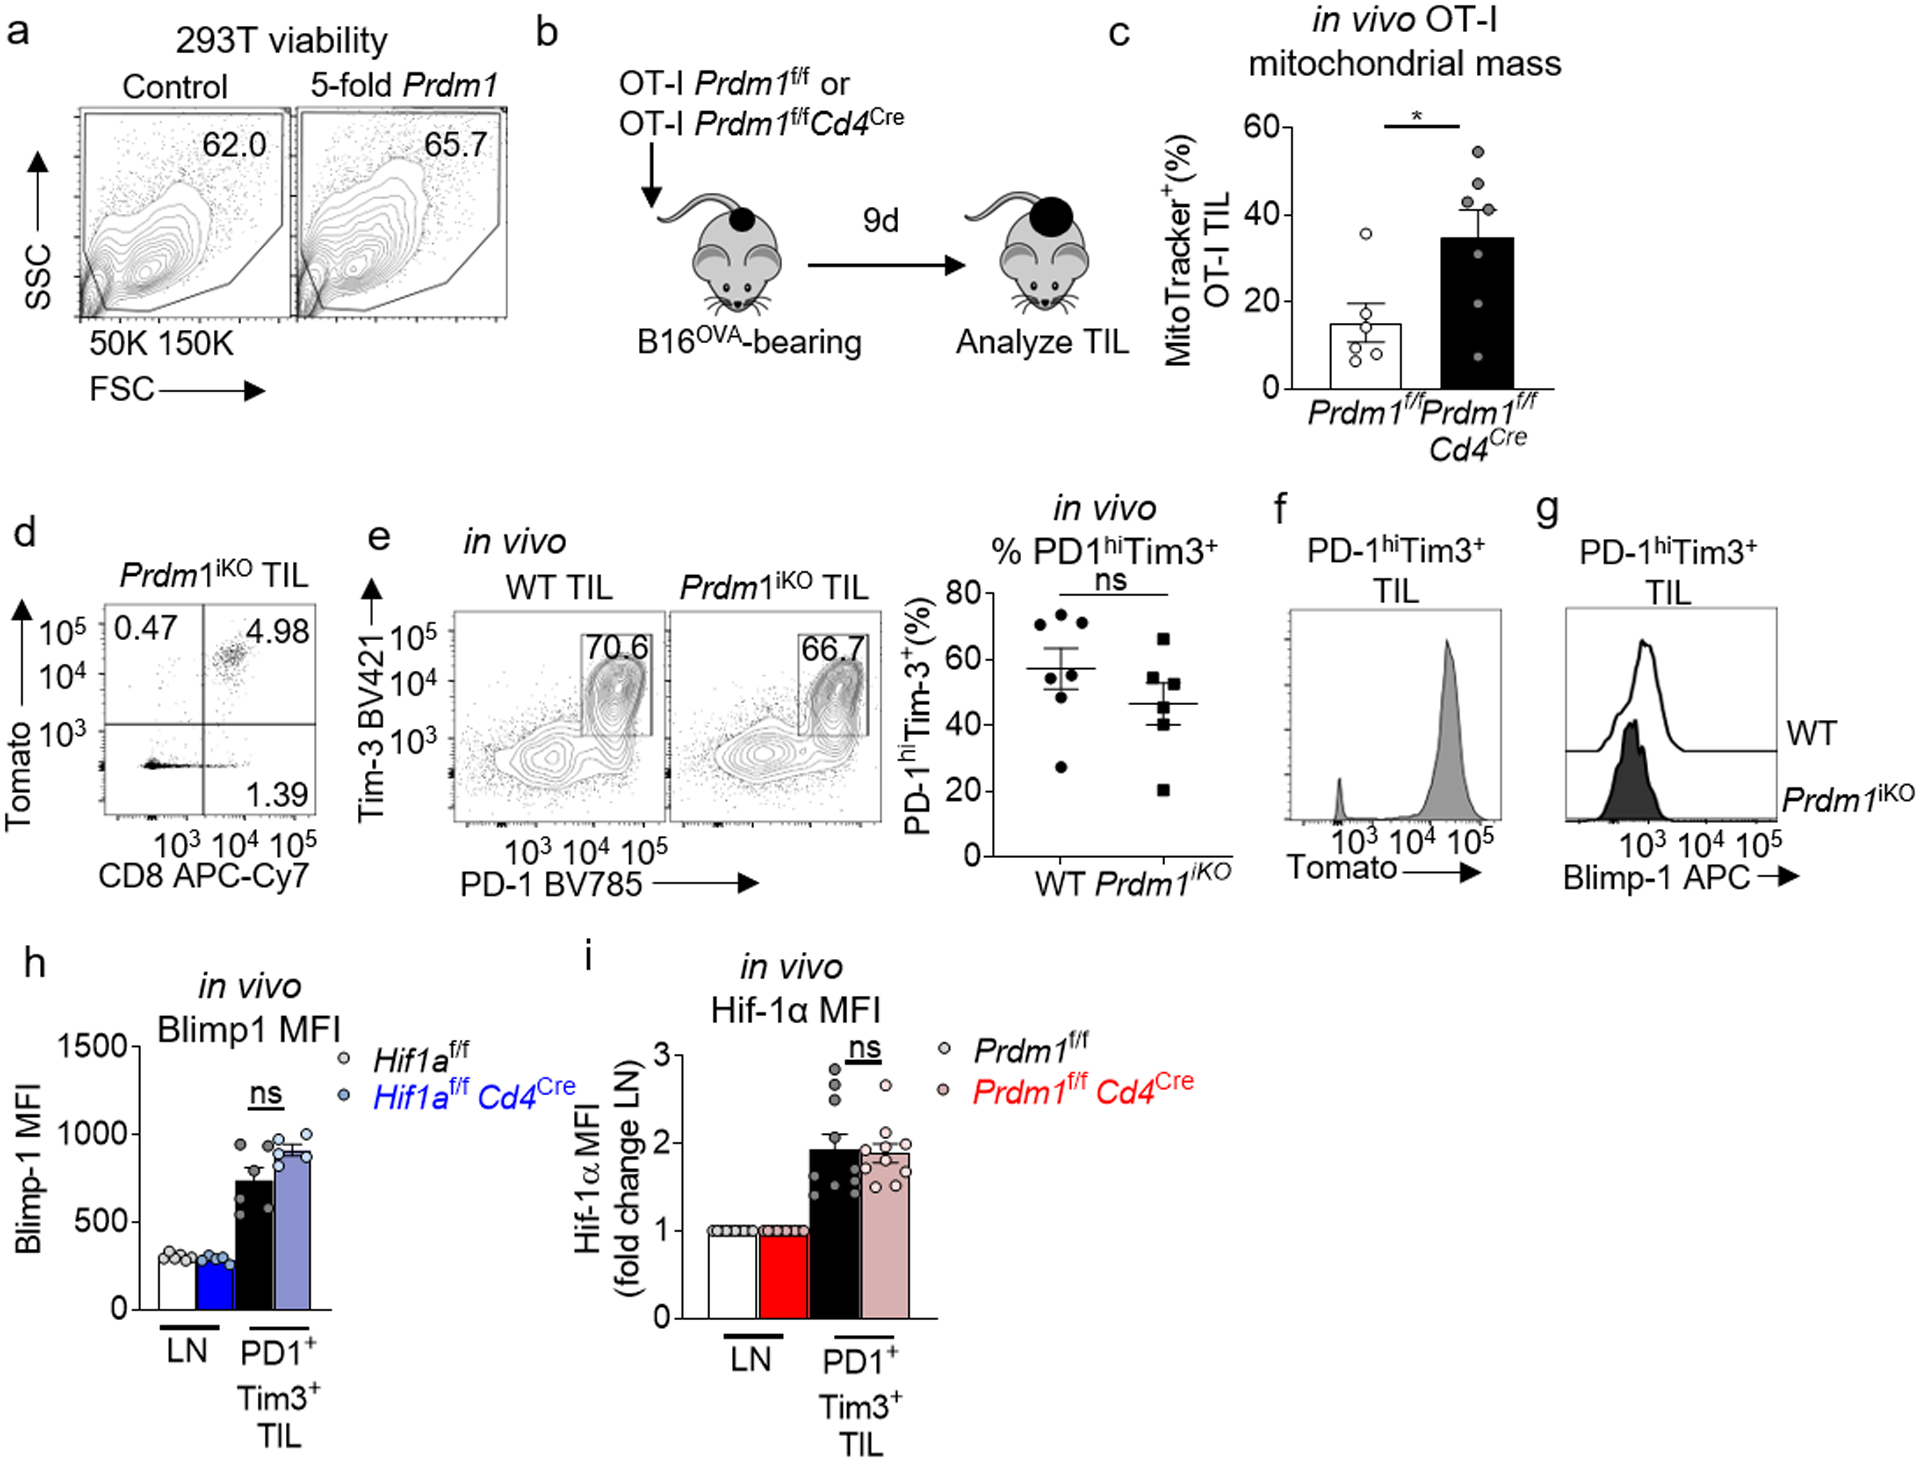
Extended Data Figure 5. Blimp-1 represses metabolic sufficiency in a HIF-1α-independent manner.

a, Viability of 293T cells from Fig. 4d assessed by flow. b, Schematic of antigen-specific Blimp-1 T cell deletion: Mice bearing 3 mm diameter B16OVA tumors received 2×10⁶ naïve OT-I Prdm1f/fCd4Cre or Prdm1f/f T cells. Nine days later, mice were sacrificed and analyzed, transferred cells identified by Thy1.1+. c, MitoTracker geometric MFI of OT-I T cells transferred as in b. WT n=7 mice, Blimp-1-deficient n=8 mice. d, E8ICreERT2Prdm1f/fR26LSL.Tomato (Prdm1iKO) TIL flow cytogram of CD8 vs Tomato expression after 5 days of tamoxifen. e, WT and Prdm1iKO TIL flow cytogram of PD-1 vs Tim3 after 5 days of tamoxifen, with accompanying quantification. WT n=7 mice, Blimp-1-deficient n=6 mice. f, Prdm1iKO TIL Tomato expression after 5 days of tamoxifen, gated on CD8+ PD-1+ Tim3+ g, WT and Prdm1iKO TIL Blimp-1 staining after 5 days of tamoxifen, gated on CD8+ PD1+ Tim3+ TIL. h, Quantification of HIF1af/fCd4Cre or Cre negative littermate control CD8+ LN and CD8+ PD1hiTim3+ TIL Blimp-1 geometric mean fluorescent intensity. WT n=6 mice, HIF-deficient n=5 mice. i, Quantification of Prdm1f/fCd4Cre or Cre negative littermate control CD8+ LN CD8+ PD1hiTim3+ TIL Hif-1α geometric mean fluorescent intensity, fold change from LN. WT n=10 mice, Blimp-1-deficient n=10 mice. All data are representative of 3–8 independent experiments. *p < 0.05 by unpaired T test (c,e,h,i). Error bars indicate SEM.
