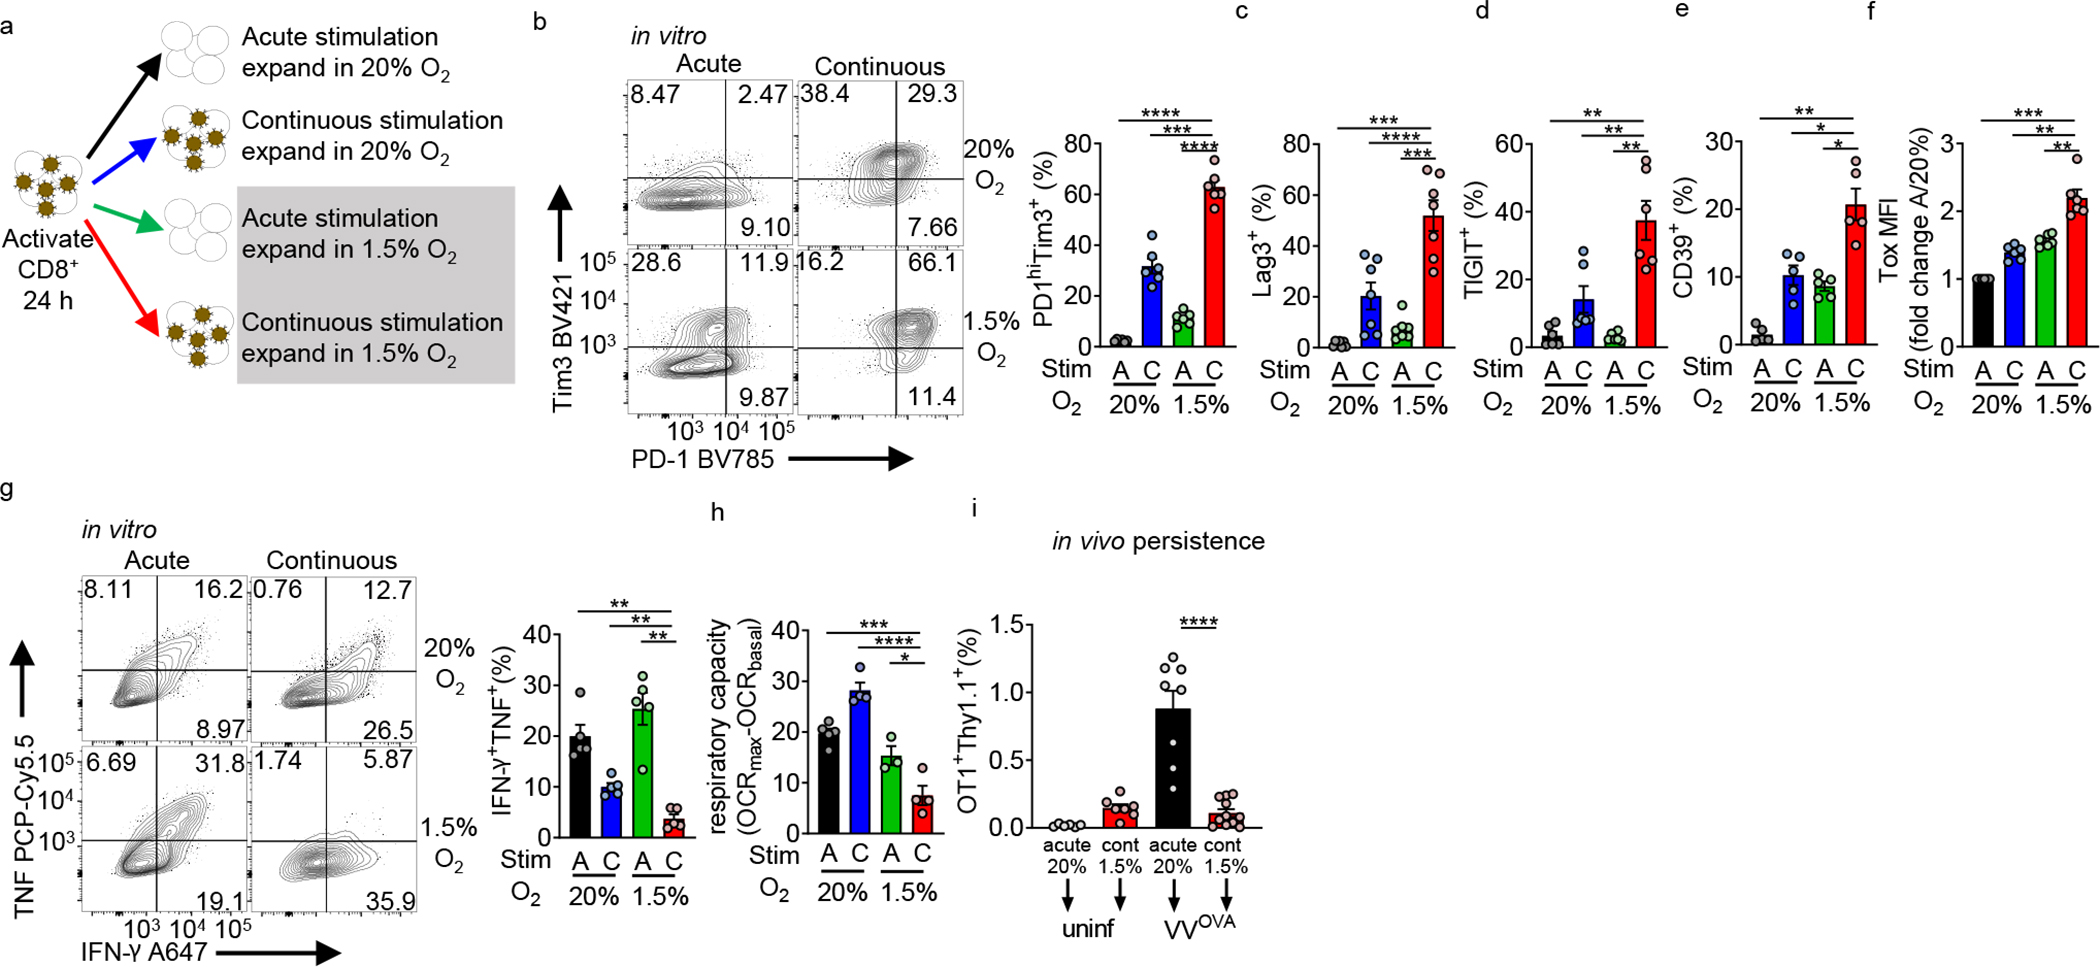
Figure 2: Continuous activation under hypoxia induces an exhausted-like dysfunctional state in CD8+ T cells.

(a) Experimental scheme. CD44hi CD8+ T cells are sorted from B6 mice, then activated with anti-CD3/anti-CD28-coated magnetic beads plus 25 U//mL IL-2 and 10 ng/mL IL-12 in normoxia (20% O2). After 24 hours, cells are washed and expanded in IL-2, but placed into various culture conditions (removing beads or continuous cocoulture with beads, under normoxia or 1.5% O2 hypoxia). (b) (left) Flow cytograms of PD-1 and Tim-3 staining in live CD8+ T cells generated using as in a accompanied by quantitation. n=6. (c–f) Quantification of Lag-3 (n=7), Tigit (n=6), CD39 (n=5), and Tox (n=6) staining as in b. (g) (left) Flow cytograms and tabulation of TNF and IFN-γ production after 16 h of PMA-ionomycin restimulation of live CD8+ T cells generated as in b. n=5. (h) Mitochondrial spare respiratory capacity (SRC: difference between basal OCR values and maximal OCR values after FCCP uncoupling) of T cells generated as in a. AN n=4, CN n=4, AH n=3, CH n=4. Graph represents 1 of 3 independent experiments. (i) Flow cytometric quantification of OT-I T cells generated as in a, then adoptively transferred into B6 mice infected intraperitoneally with 1×10⁶ PFU Vaccinia-OVA. n=3 independent in vitro experiments, transferred into multiple mice. All data are representative of 3–6 independent experiments. *p < 0.05, **p < 0.01, ***p < 0.001, ****p < 0.0001 by one-way ANOVA with Dunnett’s multiple comparison test. Error bars indicate SEM.
