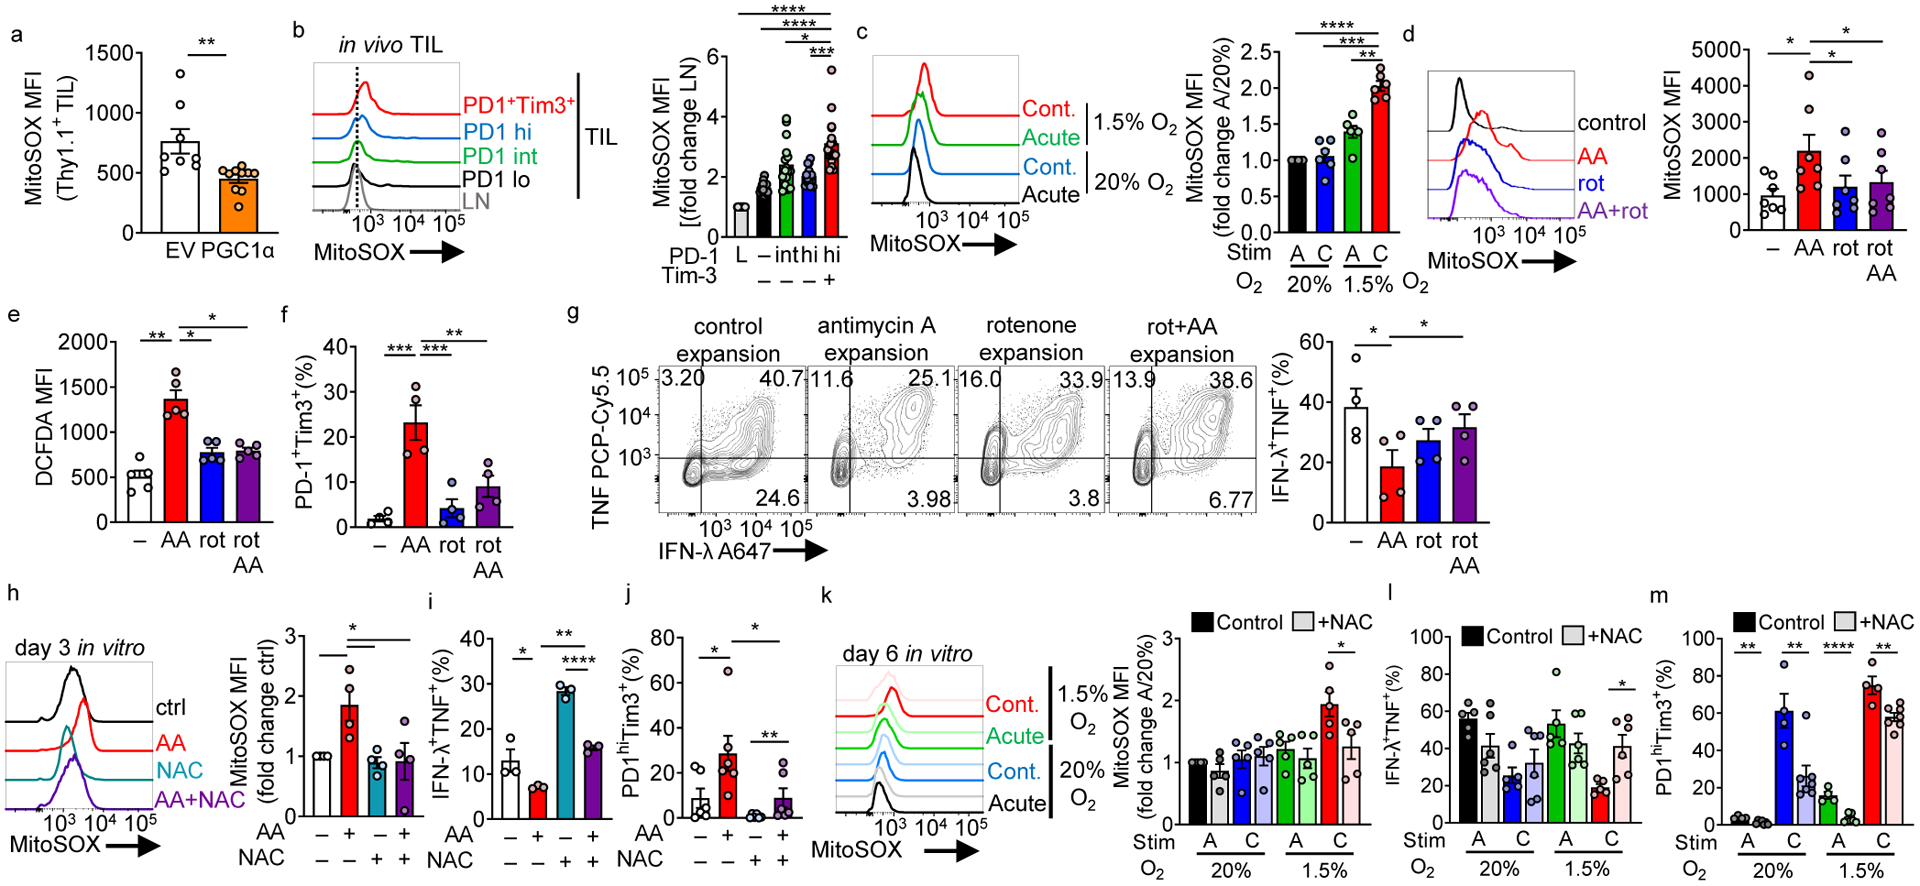
Figure 5: Continuous activation under hypoxia increases mitochondrial ROS which is sufficient to drive an exhausted-like dysfunctional program.

(a) MitoSOX (mitochondrial superoxide) staining of adoptively transferred, B16-infiltrating Pmel Thy1.1+ T cells transduced with a PGC1α retroviral expression vector (PGC1αOE) or empty vector (EV) control. EV n=8 mice, PGC1αOE n=10 mice (b) MitoSOX staining in CD8+ LN and TIL based on PD-1 and Tim-3 expression (quantitation normalized to LN cells). n=16 mice. (c) MitoSOX staining in continuous stimulation under hypoxia, normalized to acute stim in normoxia. Each group n=6. (d) MitoSOX staining of CD8+ T cells activated overnight and expanded in IL-2 and either 0.04mM mitochondrial complex III inhibitor antimycin A, 0.4mM complex I inhibitor rotenone, or simultaneous combination of the two for 3 days. n=7. (e) As in d but using the cellular ROS detector DCFDA. n=5. (f) %PD1hiTim3+ cells as in d cultured for 6 days. n=4. (g) IFN-γ and TNF production in T cells generated as in d for 7 days, after stimulation with anti-CD3/anti-CD28. n=4 (h) MitoSOX staining of CD8+ T cells activated overnight and then expanded in IL-2 and either antimycin A, 10 mM n-acetyl-cysteine (NAC), or simultaneous combination of the two for 3 days. Each group n=4. (i) IFN-γ and TNF production in T cells in h after stimulation with anti-CD3/anti-CD28 overnight. n=3 (j) %PD1hiTim3+ cells in cells as in h. n=6. (k) MitoSOX (control n=5, NAC n=5), (l) IFN-γ and TNF production (control n=5, NAC n=6), and (m) PD-1 and Tim3 staining (control n=4, NAC n=7), in continuous stimulation under hypoxia +/− 10mM NAC. All data are representative of 3–7 independent experiments. *p < 0.05, **p < 0.01, ***p < 0.001, ****p < 0.0001 by one-way ANOVA with Dunnett’s multiple comparison test (b-j) or unpaired T test (a,k-m). Error bars indicate SEM.
