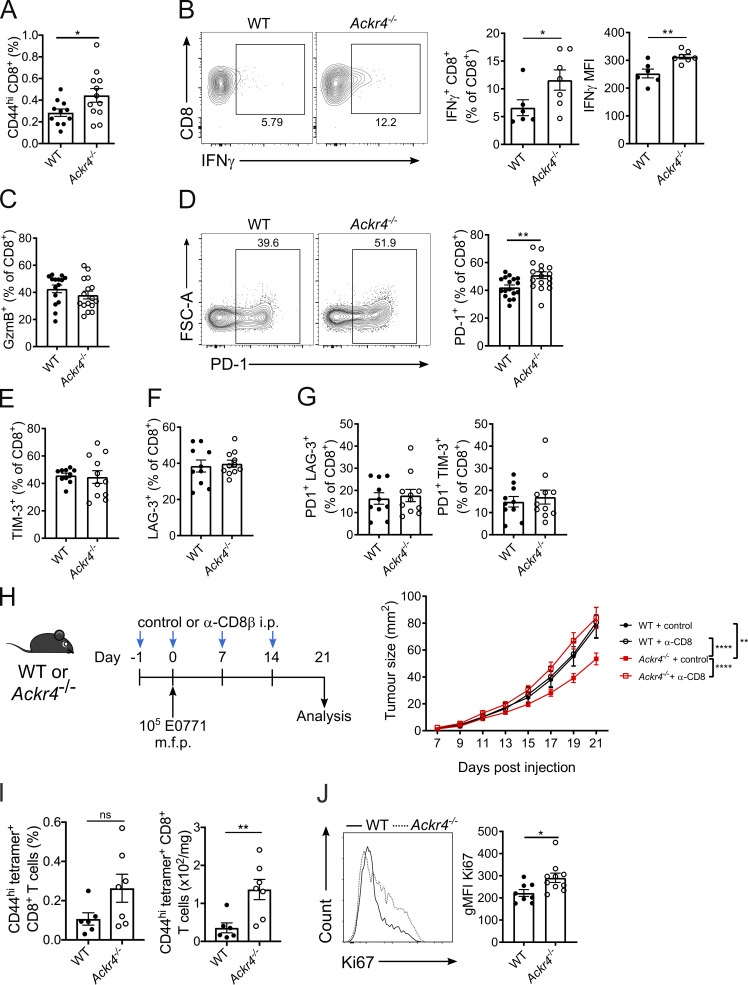
Figure 2.
ACKR4-deficient mice mount an enhanced antitumor CD8+ T cell response. (A–G) WT or Ackr4−/− mice were injected with 105 E0771 cells and analyzed 18–21 d after injection. (A) Frequency of CD44hi CD8+ T cells (of total viable cells) in tumors; n = 11–13, unpaired t test. MFI, mean fluorescence intensity. (B) Frequency of IFN-γ expression in intratumor CD8+ T cells and MFI of IFN-γ+ CD8+ T cells; n = 6–7, unpaired t test. (C and D) Frequency of granzyme B (C) or PD-1 expression (D) in intratumor CD8+ T cells; n = 17, unpaired t test. FSC-A, forward scatter area. (E–G) Frequency of TIM-3 (E), LAG-3 (F), PD-1+ TIM-3+ (G), or PD-1+ LAG-3+ expression in intratumor CD8+ T cells; n = 10–11. (H) WT or Ackr4−/− mice were injected with E0771 cells and treated with 100 µg anti-CD8β depleting antibody or isotype control. Tumor growth curve; n = 9–14, two-way ANOVA. m.f.p., mammary fat pad. (I) Frequency (of total viable cells) and number of OVA-specific CD8+ T cells in E0771-OVA tumors; n = 6–7 mice, unpaired t test. (J) Representative flow cytometry and geometric mean fluorescence intensity (gMFI) of Ki67 on intratumor CD8+ T cells from mice injected with 105 E0771 cells; n = 10, unpaired t test. Data are pooled (A, C, G, and H) or representative (B, I, and J) from at least two independent experiments (experiments shown in E–G were performed once). Data represent mean ± SEM; *, P ≤ 0.05; **, P ≤ 0.01; ****, P ≤ 0.0001; ns, P > 0.05.

