Figure S1.
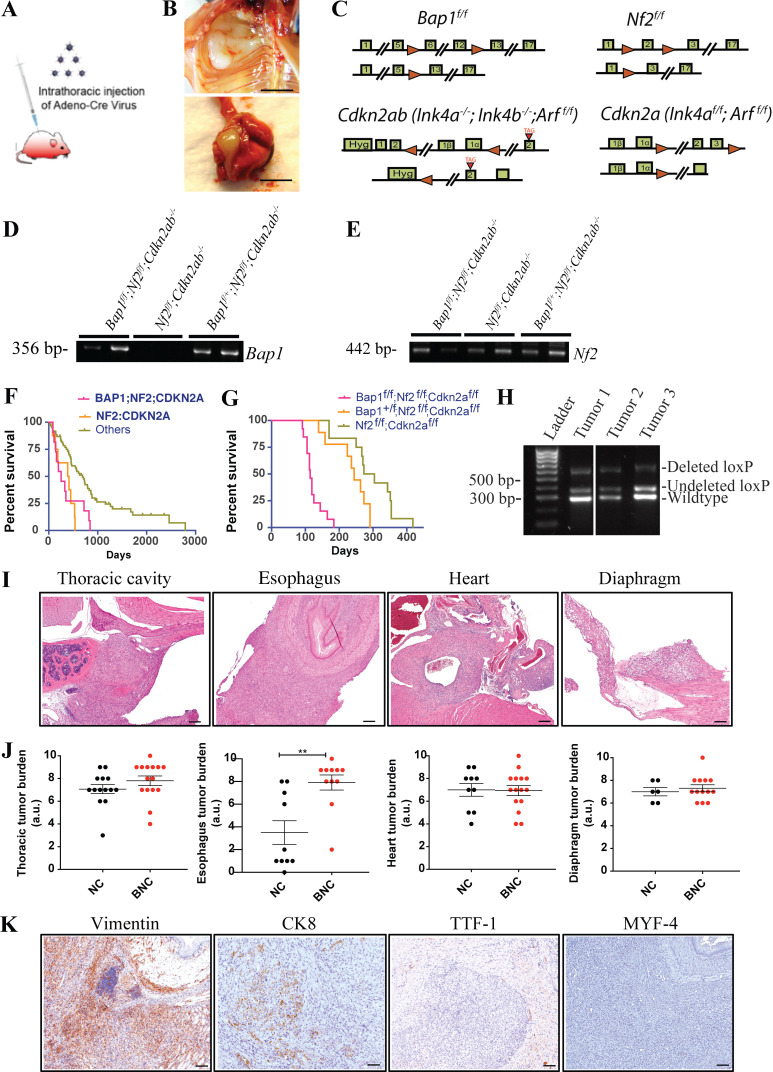
BAP1 loss accelerates tumor development in a mouse model of mesothelioma. (A) Schematic of intrathoracic injection of Adeno-Cre virus into the pleural space of a mouse by insulin injection syringe to induce deletion of floxed alleles in mesothelial layers. (B) Photographs of mesothelioma in thoracic wall and lungs/pleura. Scale bars are 5 mm. (C) Schematic of gene targeting in murine ES cells of the Bap1 (obtained from the European Conditional Mouse Mutant repository consortium), Nf2, Cdkn2a, and Cdkn2ab loci. The Cdkn2ab mice are germline deleted for Ink4a and Ink4b but conditional for p19Arf. The Cdkn2a mice are conditional for Ink4a and Arf. The first row of each knockout strategy is the loci after loxp site (red triangles) insertion, and the second row represents loci after the Cre recombination. (D) PCR amplification of the flanking genomic DNA of the lox sites confirms the deletion of Bap1 floxed alleles in mice MM tumors. (E) PCR confirms the deletion of Nf2 floxed alleles in mice MM tumors. Presence of DNA band in gel indicates deletion of floxed alleles of Bap1 and Nf2. (F) Overall survival of mesothelioma patients from the TCGA cohort with combined inactivation of BAP1;NF2;CDKN2A, NF2:CDKN2A, and other lesions. (G) Overall survival of Ad-CMV-Cre–activated Bap1f/f;Nf2f/f;Cdkn2af/f (BNCa; n = 13), Bap1f/+;Nf2f/f;Cdkn2af/f (n = 9), and Nf2f/f;Cdkn2af/f (NCa; n = 12). All mice are of mixed C57BL/6 and FVB background. (H) PCR amplification of wild-type band without any lox site confirms no LOH. (I) H&E image of mesothelioma of BNC mice in different organs of the thoracic cavity. Scale bars are 200 µm. (J) Quantification of tumor burden in different organs/location of BNC and NC mice with MM. The y axis represents values in the scale of 1 to 10. 10 is the highest tumor burden, and 0 is no tumor. The y axis values were assessed by the fraction of the tumor cells in histopathology slides of each organ. Unpaired Student’s t test was used to analyze the data in B. **, P < 0.01. Error bars represent mean ± SEM. (K) Representative IHC staining of vimentin, CK8, TTF-1, and MYF-4. Scale bars are 100 µm. For CK8, scale bar is 50 µm.

