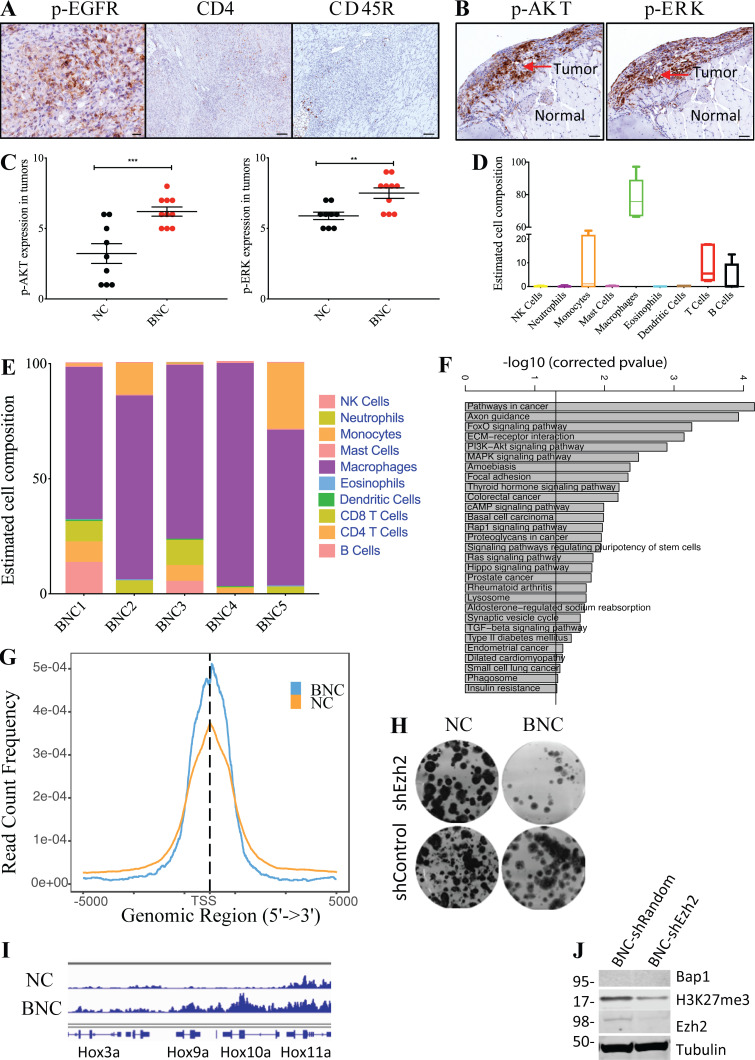
Figure S2.
Mouse BNC mesothelioma shows hyperactivation of MAPK and PI3K pathways and exhibits an inflammatory tumor microenvironment. (A) Representative IHC staining of p-EGFR, CD4, and CD45R of mouse mesothelioma. Scale bar is 20 µm for p-EGFR and 50 µm for CD4 and CD45R. (B) IHC staining of p-ERK, and p-AKT of mouse mesothelioma at 4 wk after Adeno-Cre injection. Scale bars are 50 µm. (C) Quantification of p-AKT and p-ERK staining in BNC (n = 10) and NC (n = 9) mice with MM. The y axis represents values in the scale of 1 to 10. 10 is the highest (staining intensity + fraction of tumor cells) burden, and 0 is no staining. Unpaired Student’s t test was used to analyze the data in B. **, P < 0.01, ***, P < 0.001. Error bars represent mean ± SEM. (D) Box plot of estimated cell composition of 10 immune cell types in percentage in five independent BNC mouse mesothelioma tumors by Seq-ImmuCC. Error bars on the whiskers represent min to max. (E) Bar plot showing relative immune cell estimates of 10 different immune cells in five BNC tumors as determined by Seq-ImmuCC. (F) Plot showing significantly enriched KEGG pathways in overexpressed genes in BNC mesothelioma cells. (G) Plot showing enrichment of H2A119ub1 binding in TSS in both NC and BNC mesothelioma cells. (H) Clonogenicity assay of BNC and NC mesothelioma cells upon EZH2 inhibition by shRNA. (I) Enrichment plot showing normalized binding in the Hox cluster of both BNC and NC mesothelioma cells. Data are based on at least two independent experiments. (J) Immunoblot showing BAP1, H3K27me3, EZH2, and Tubulin upon Ezh2 knock-down by shRNA in BNC and NC cells.

