Figure 1.
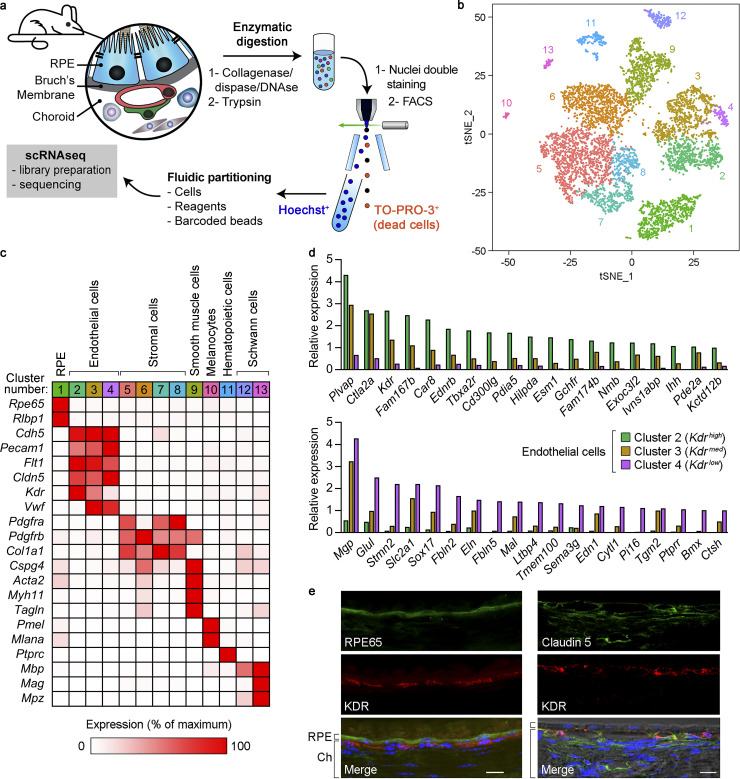
Characterization of mouse RPE/choroid by scRNAseq and identification of transcriptionally distinct choroidal EC subtypes. (a) Scheme of the preparation of RPE/choroid single-cell suspensions by sequential enzymatic digestion and cell sorting. Hoechst+/TO-PRO-3− live cells were subjected to scRNAseq. (b) Principal-component analysis of 7,723 single-cell expression profiles obtained from RPE/choroid tissue from four mice (C57BL/6J and B6129PF1/J strains, one male and one female per strain). Data are shown in two dimensions using tSNE. Unsupervised analysis clustered cells into 13 transcriptionally distinct cell populations, each plotted in a different color. (c) Identification of cell types in RPE/choroid tissue from B6129PF1/J mice according to the average expression of known markers in each cluster. Cluster number colors are the same as in panel b. Relative gene expression among cell types was calculated using the average normalized UMIs in each cluster and represented as the percentage of the cluster with maximum expression. White, 0%; red, 100%. (d) Genes with at least fivefold differential expression between Kdrhigh (green bars) and Kdrlow (purple bars) ECs (Benjamini–Hochberg adjusted likelihood-ratio test, adj P < 0.05). Only genes with maximum average normalized UMIs ≥1 are shown. Relative gene expression in Kdrmed ECs (brown bars) is also included. Top: Kdrhigh expression at least fivefold higher than Kdrlow. Bottom, Kdrlow expression at least fivefold higher than Kdrhigh. (e) Immunofluorescence analysis of KDR (red), RPE65 (RPE marker), and claudin-5 (pan-endothelial marker; green) expression in mouse eye cryosections. Nuclear staining with DAPI (blue) and differential interference contrast images are also included in merged panels. Position of RPE and choroid (Ch) is indicated on the left of merged images. Scale bars, 5 µm (left) and 10 µm (right). Images are representative of four mice.

