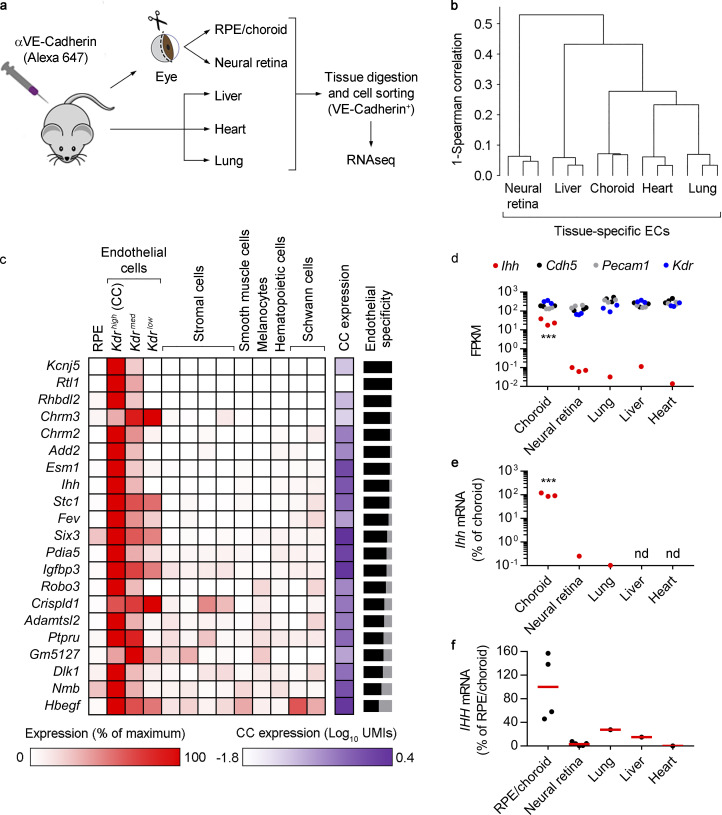
Figure 2.
Transcriptional analysis of tissue-specific mouse ECs and Ihh expression in choriocapillaris ECs. (a) Diagram showing the isolation of tissue-specific ECs after intravital EC labeling. For RPE/choroid and neural retina, seven animals (14 eyes) were used per isolation; for lung, liver, and heart, one animal was used per isolation. Bulk RNAseq was performed using RNA from three independent isolations. (b) Hierarchical clustering of FPKM profiles showing separate clustering of tissue-specific ECs (n = 3). (c) Signature genes of mouse choroidal ECs and relative expression among RPE/choroid cell types. Using data from the bulk RNAseq analyses of tissue-specific ECs, the list was assembled by selecting the genes with expression levels at least fivefold higher in choroidal ECs compared with the rest of the tissue-specific ECs (n = 3, Benjamini–Hochberg corrected adj P < 0.05), with a detection threshold set at ≥1 FPKM. The list was then interrogated against our scRNAseq data to assess the relative expression of each gene among all cell types, which was calculated using the average normalized UMIs in each cluster and represented as the percentage of the cluster with maximum expression. White, 0%; red, 100%. The column labeled “CC expression” shows the average normalized UMIs (log10) for each gene in Kdrhigh ECs, i.e., the choriocapillaris (CC), represented in a white-purple scale. Black-gray bars on the right represent EC specificity compared with the rest of RPE/choroid cell types. For each gene, the sum of the average normalized UMIs in Kdrhigh, Kdrmed, and Kdrlow ECs was represented as the percentage of total average normalized UMIs (the sum of average normalized UMIs in all clusters). The black portion of the bars represents the percentage of estimated EC specificity. Only genes with >50% EC specificity are shown. (d) Bulk RNAseq results showing the expression (FPKM) of Ihh (red) and the EC markers Cdh5 (black), Pecam1 (gray), and Kdr (blue) in tissue-specific ECs (n = 3). ***, Benjamini–Hochberg corrected adj P < 0.001 all groups versus choroidal ECs. (e) Real-time PCR showing relative Ihh expression in tissue-specific ECs. Results are presented as the percentage of the average value for choroidal ECs (n = 3, ANOVA + Bonferroni test). ***, P < 0.001 all groups versus choroidal ECs. nd, not detected. (f) Real-time PCR showing relative IHH expression in human whole tissues (RPE/choroid, n = 4; neural retina, n = 5; commercially obtained lung, liver, and heart, n = 1). Biological replicates are shown as black dots. Red lines show the average expression in RPE/choroid and neural retina. Results are presented as the percentage of the average value for RPE/choroid tissue.

