Figure 3.
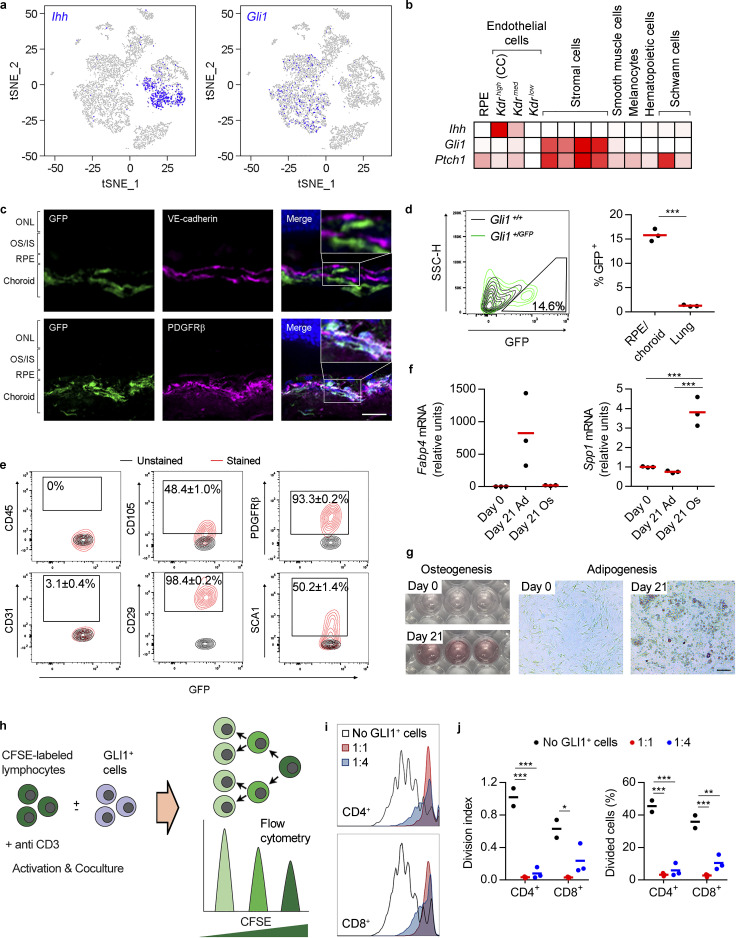
Characterization of choroidal GLI1+ cells. (a) tSNE graphs showing the predominant expression of Ihh and Gli1 in KDRhigh ECs (CC, choriocapillaris) and stromal cells, respectively. (b) Heatmap showing the relative expression of Ihh, Gli1, and Ptch1 in RPE/choroid cell types, calculated using the average normalized UMIs in each cluster and represented as the percentage of the cluster with maximum expression. White, 0%; red, 100%. (c) Immunofluorescence assays using eye cryosections from Gli1GFP/+ mice show the perivascular localization of choroidal GLI1+ cells (GFP+, green). Top: Localization of GFP+ cells and VE-cadherin+ ECs (purple) is mutually exclusive. Bottom: GFP+ cells colocalize with the stromal marker PDGFRβ (purple). Colocalization in the merged images is shown in white. Nuclei were stained with Hoechst (blue). Zoomed representative regions of the merged images are shown as insets on the right panels. ONL, outer nuclear layer; OS/IS, outer segments/inner segments. Scale bar, 20 µm. Results are representative of at least two independent experiments. (d) Percentage of GLI1+ cells (GFP+) in RPE/choroid and lung. Left: Representative quantification of choroidal GLI1+ cells from Gli1GFP/+ mice by flow cytometry (green lines). Gli1+/+ mice (black lines) were used as a negative control to set background fluorescence levels. Right: Choroid and lung GLI1+ cells were quantified by flow cytometry and represented as the percentage of total cells in each tissue (n = 3, t test). ***, P < 0.001. (e) Characterization of choroidal GLI1+ cells by flow cytometry. Gated GLI1+ cells (GFP+) were analyzed for the expression of CD45 (hematopoietic marker), CD31 (EC marker), and the MSC markers CD105, CD29, PDGFRβ, and SCA1. Unstained samples (black lines) were used to set background fluorescence levels. Numbers show the percentage ± SD (n = 3) of GFP+ cells positive for the different markers. (f) Choroidal GLI1+ cells were isolated from Gli1GFP/+ mice by cell sorting (GFP+ cells) and expanded in culture. GLI1+ cells were exposed to adipogenic (Ad) or osteogenic (Os) media, and expression of Fabp4 and Spp1 (adipocyte and osteoblast markers, respectively) was assessed by real-time PCR at days 0 and 21 of differentiation (n = 3, ANOVA + Bonferroni test). ***, P < 0.001. (g) GLI1+ cells were cultured in osteogenic (left) or adipogenic (right) media for 21 d. Osteogenic and adipogenic differentiation was assessed by the appearance of calcium deposits (Alizarin red S staining) or intracellular lipid vesicles (oil red O staining), respectively. Day 0 cultures were included as controls. (h) Inhibition of T cell proliferation by GLI1+ cells (experiment outline). CFSE-labeled allogeneic mouse splenocytes were activated with anti-CD3 antibody and cultured alone or in the presence of choroid GLI1+ cells at different ratios (GLI1+ cells/splenocytes, 1:1 and 1:4) for 4 d. (i) CFSE dilution histograms showing that the proliferation of CD4+ and CD8+ T cells (white histogram) is strongly inhibited by choroidal GLI1+ cells at both 1:1 and 1:4 ratios. (j) Quantification of panel i using the division index (average number of divisions after stimulation) and the percentage of divided cells (No GLI1+ cells, n = 2; 1:1, n = 3; 1:4, n = 3; ANOVA + Bonferroni test). *, P < 0.05; **, P < 0.01; ***, P < 0.001. Results in panels f–j are representative of two independent experiments.

