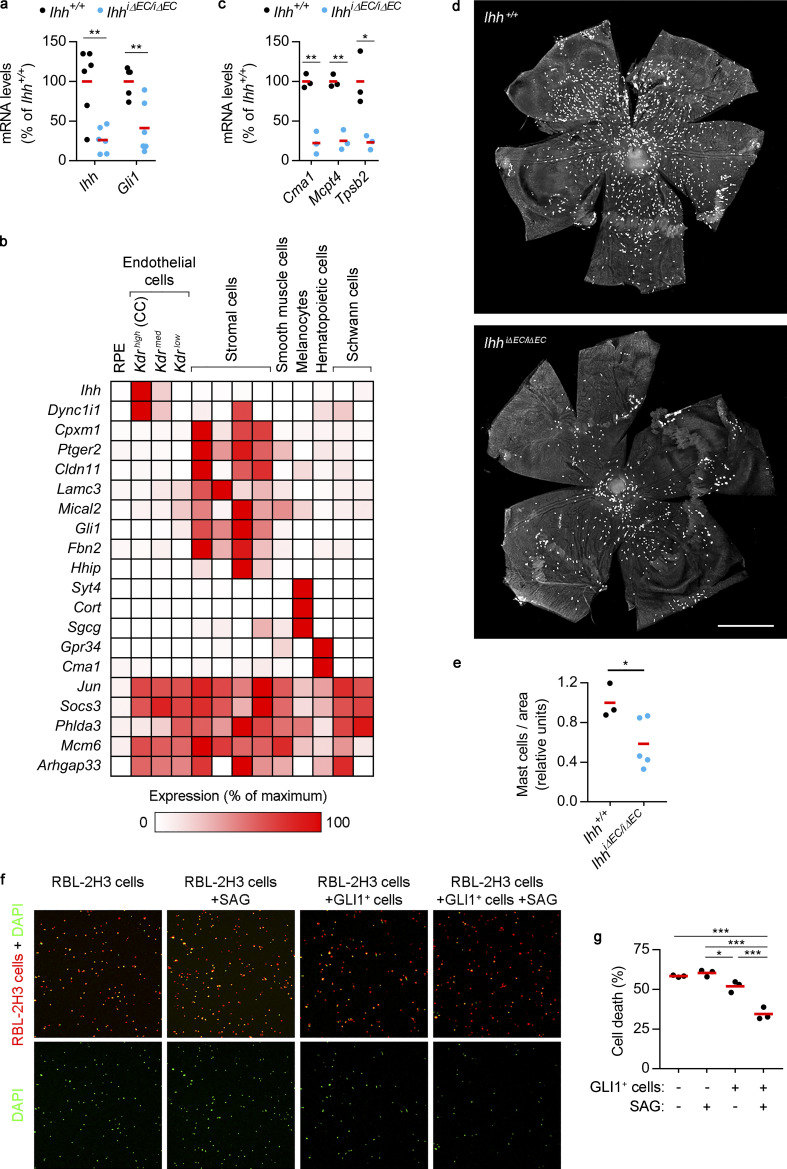
Figure 4.
RPE/choroid transcriptional alterations and loss of choroidal mast cells after EC-specific Ihh deletion. (a) Real-time PCR showing Ihh and Gli1 expression levels in RPE/choroid tissue from Ihh+/+ and IhhiΔEC/iΔEC mice (black and blue dots, respectively). Individual dots correspond to different animals, and red bars represent average values. Relative gene expression is presented as the percentage of Ihh+/+ mice (n = 6, t test). **, P < 0.01. (b) RNAseq analysis of RPE/choroid tissue from Ihh+/+ and IhhiΔEC/iΔEC mice and cross-comparison with scRNAseq data. The heatmap shows genes with ≥1 FPKM in Ihh+/+ mice that were significantly down-regulated in IhhiΔEC/iΔEC mice (n = 3, at least twofold change, Benjamini–Hochberg corrected adj P < 0.05). Their relative expression across RPE/choroid cell types was calculated using the average normalized UMIs in each cluster and represented as the percentage of the cluster with maximum expression. White, 0%; red, 100%. (c) Real-time PCR showing the expression of mast cell markers in RPE/choroid tissue from Ihh+/+ and IhhiΔEC/iΔEC mice (n = 3, t test). *, P < 0.05; **, P < 0.01. Results are represented as in panel a. (d) Representative avidin staining assay to localize choroidal mast cells using flatmounts from albino Ihh+/+ and IhhiΔEC/iΔEC mice. Scale bar, 1,000 µm. (e) Quantification of avidin staining assays shown in panel d. Results are expressed as number of mast cells normalized by flatmount area and presented as relative units (Ihh+/+, n = 3; IhhiΔEC/iΔEC, n = 5, t test). *, P < 0.05. (f) In vitro assays to study the survival of serum-starved RBL-2H3 cells (red) in the absence or presence of choroidal GLI1+ cells and the HH pathway agonist SAG. Dead cells are DAPI+ (green). (g) Quantification of RBL-2H3 cell death shown in panel f. The graph shows the percentage of DAPI+ RBL-2H3 cells. Black dots correspond to biological replicates, and red bars represent average values (n = 3, ANOVA + Bonferroni test). Results are representative of two independent experiments. *, P < 0.05; ***, P < 0.001.

