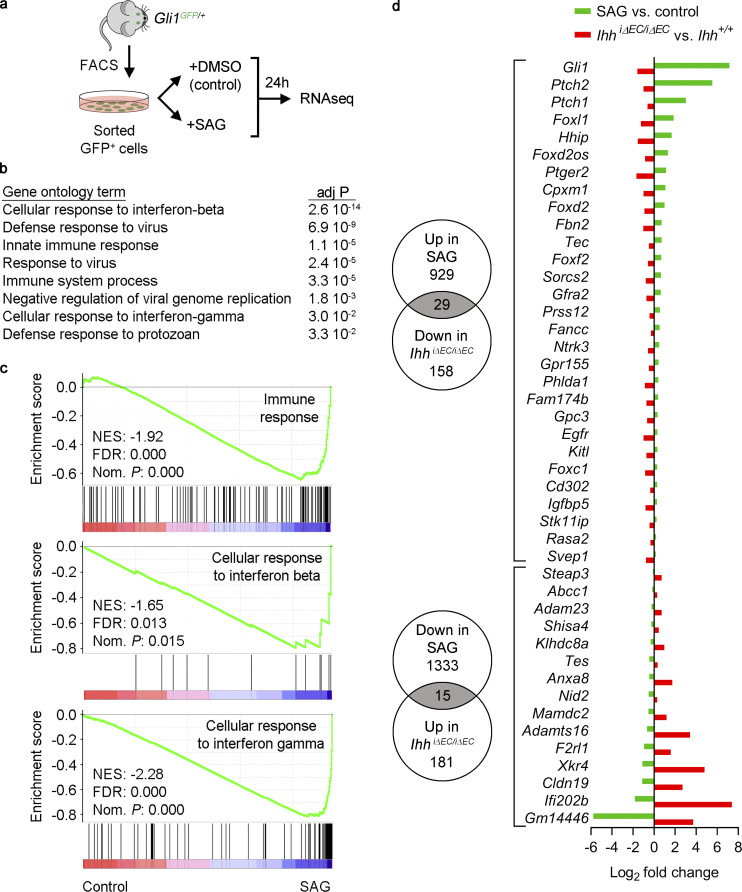
Figure 5.
HH signaling modulates the expression of inflammation-related genes in choroidal GLI1+ cells. (a) Experiment outline. GLI1+ cells (GFP+) were isolated from RPE/choroid tissue of Gli1GFP/+ mice by FACS. Cultured cells were exposed to the HH pathway agonist SAG (100 nM) or vehicle (DMSO) for 24 h, and gene expression was analyzed by RNAseq. (b) Biological process (GOTERM_BP_DIRECT) Gene Ontology analysis of control- and SAG-treated GLI1+ cells using DAVID software, considering genes with log2 fold change ≤−1 and ≥1 (n = 3, Benjamini–Hochberg corrected adj P < 0.05). Significantly enriched gene sets are shown (Benjamini-corrected adj P < 0.05). (c) Pre-ranked GSEA shows that SAG treatment reduces the expression of immune-related genes. FDR, false discovery rate q-value; NES, normalized enrichment score; Nom. P, nominal P value. (d) Genes with inversely correlated differential expression between HH activation in vitro (GLI1+ cells after SAG treatment) and inhibition in vivo (RPE/choroid tissue after EC-specific Ihh deletion). Numbers in Venn diagrams indicate the number of genes significantly up- or down-regulated in each condition (Benjamini–Hochberg corrected adj P < 0.05). Gray intersections indicate the number of overlapping genes for each comparison, which are listed on the graph on the right. Green bars represent genes up- or down-regulated in SAG-treated GLI1+ cells compared with control cells, and red bars represent genes up- or down-regulated in RPE/choroid tissue from IhhiΔEC/iΔEC mice compared with Ihh+/+ mice.

