Figure 6.
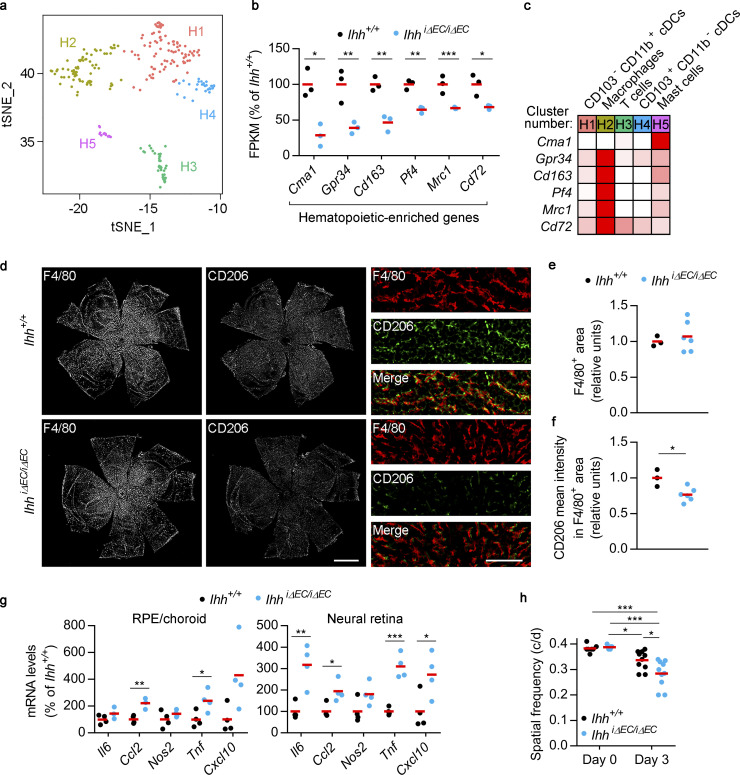
EC-specific Ihh deletion alters choroidal and retinal inflammatory responses and aggravates visual function impairment after tissue damage. (a) tSNE graph showing five transcriptionally distinct subclusters (H1–H5) within choroidal hematopoietic cells, as determined by scRNAseq. (b) RNAseq data showing genes significantly enriched in choroidal hematopoietic cells (as determined by our scRNAseq results) and down-regulated in RPE/choroid from IhhiΔEC/iΔEC mice (blue dots) compared with Ihh+/+ mice (black dots). Individual dots correspond to different animals, and red bars represent average values. Relative gene expression is presented as the percentage of Ihh+/+ mice (n = 3, Benjamini–Hochberg corrected adj P value). *, P < 0.05; **, P < 0.01; ***, P < 0.001. (c) Relative expression levels of the genes shown in panel b among choroidal hematopoietic subclusters calculated using the average normalized UMIs in each subcluster and represented as the percentage of the subcluster with maximum expression. White, 0%; red, 100%. (d) Immunofluorescence analysis of F4/80 and CD206 expression in RPE/choroid flatmounts from albino Ihh+/+ and IhhiΔEC/iΔEC mice. Scale bar, 1,000 µm. Panels on the right show zoomed-in regions (scale bar, 125 µm). (e) Quantification of F4/80+ area shown in panel d. Results are normalized by flatmount area and presented as relative units (Ihh+/+, n = 3; IhhiΔEC/iΔEC, n = 6, t test). (f) Quantification of CD206 intensity within F4/80+ area shown in panel d. Results are presented as relative units (Ihh+/+, n = 3; IhhiΔEC/iΔEC, n = 6, t test). *, P < 0.05. (g) Real-time PCR assays showing relative expression levels of pro-inflammatory genes in RPE/choroid (left) and neural retina (right) from Ihh+/+ and IhhiΔEC/iΔEC mice 3 d after i.v. administration of 15 mg kg−1 NaIO3. Results are presented as in panel a (n = 4, t test). *, P < 0.05; **, P < 0.01; ***, P < 0.001. (h) Optomotor response analyses of Ihh+/+ and IhhiΔEC/iΔEC mice before (day 0) and after (day 3) NaIO3 administration (day 0, n = 7; day 3, n = 10; ANOVA + Bonferroni test). *, P < 0.05; ***, P < 0.001. c/d, cycles per degree.

