Figure S1.
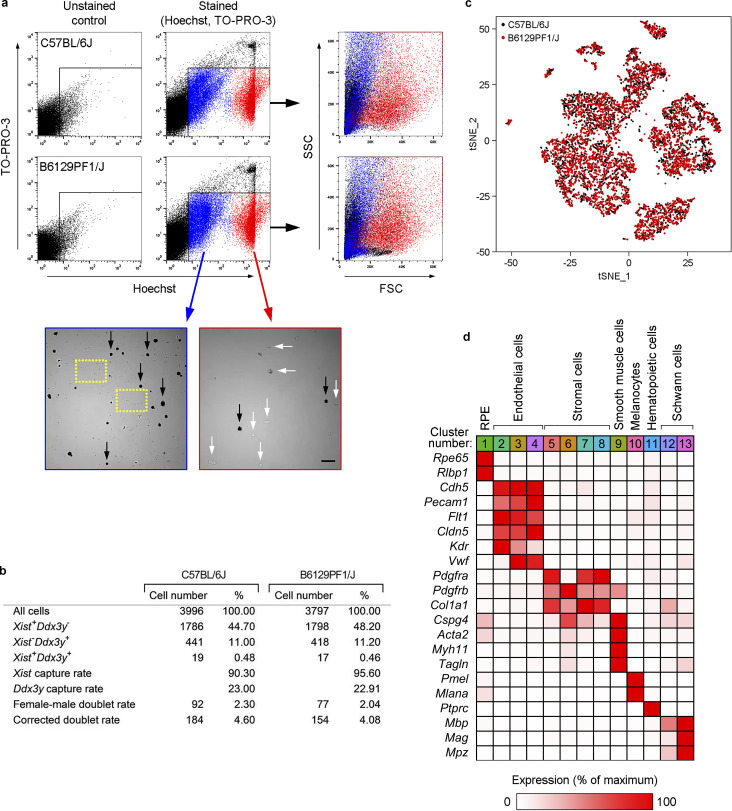
scRNAseq of RPE/choroid tissue. (a) Cell sorting to prepare RPE/choroid single-cell suspensions suitable for scRNAseq. Experiments were performed with the strains C57BL/6J (top panels) and B6129PF1/J (bottom panels). For each strain, RPE/choroid tissue from one male and one female eye was pooled, digested, and stained with Hoechst and TO-PRO-3 to label nucleated and dead cells, respectively. Unstained samples were used as controls to set the gating parameters. Pilot experiments showed two different Hoechst+/TO-PRO-3− populations with dim (blue dots) and high (red dots) Hoechst staining. Hoechstdim events presented very low forward scatter (FSC; right panels), suggesting that this population could be debris. To assess the cellular content of both populations, we sorted Hoechstdim/TO-PRO-3− and Hoechsthigh/TO-PRO-3− events independently and observed them under the microscope. The Hoechstdim population contained cell debris (dashed yellow squares) but also many cells that were mainly pigmented (black arrows). Hence, our results suggest that cell pigment present in RPE and melanocytes may decrease the apparent FSC of both cell types. The Hoechsthigh population (red) was virtually free of debris and mainly constituted by nonpigmented cells (white arrows). To avoid loss of pigmented cells, both Hoechstdim/TO-PRO-3− and Hoechsthigh/TO-PRO-3− populations were sorted together in the same collecting tube and used for scRNAseq assays. Scale bar, 50 µm. (b) Estimation of doublet content in scRNAseq assays (see calculations in Materials and methods). (c) Principal-component analysis of 7,723 single-cell expression profiles obtained from a mix of male (n = 1 per strain) and female (n = 1 per strain) RPE/choroid tissue. Data are shown in two dimensions using tSNE after CCA batch correction. Black dots, 3,996 cells from C57BL/6J mice; red dots, 3,727 cells from B6129PF1/J mice. (d) Identification of cell types in RPE/choroid tissue from C57BL/6J mice according to the average expression of known markers in each cluster. Cluster number colors are the same as in Fig. 1 (b and c). Relative gene expression among cell types was calculated using the average normalized UMIs in each cluster and represented as the percentage of the cluster with maximum expression. White, 0%; red, 100%.

