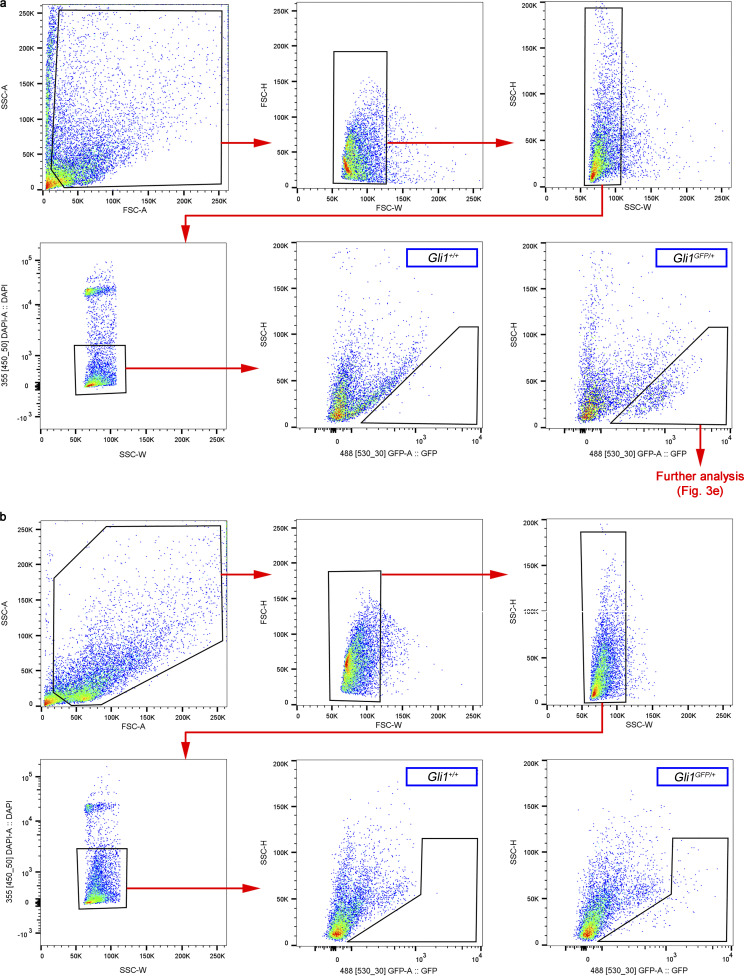
Figure S2.
Gating strategy to quantify and characterize GLI1+ cells from Gli1GFP/+ mice by flow cytometry. (a and b) Analysis of GFP+ cells from RPE/choroid (a) and lung (b). Tissue from Gli1+/+ mice was used as negative control. FSC-H, forward scatter height; SSC-A, side scatter area; SSC-H, side scatter height; SSC-W, side scatter width.

