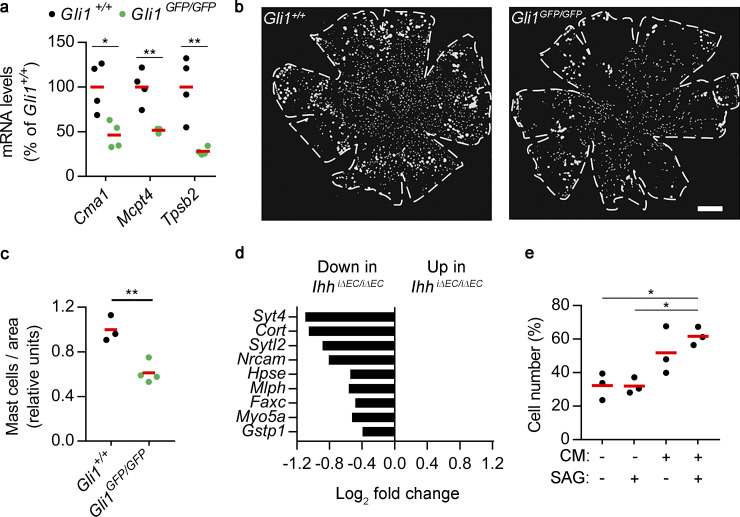
Figure S3.
Effects of HH signaling on choroidal mast cells and melanocyte proliferation. (a) Real-time PCR showing the expression of mast cell markers in RPE/choroid tissue from Gli1+/+ and Gli1GFP/GFP mice (black and green dots, respectively). Individual dots correspond to different animals, and red bars represent average values. Relative gene expression is presented as the percentage of Gli1+/+ mice (n = 4, t test). *, P < 0.05; **, P < 0.01. (b) Representative avidin staining assay to localize choroidal mast cells using flatmounts from albino Gli1+/+ and Gli1GFP/GFP mice. Panels show binary images used for segmentation, and dashed lines delineate flatmount contours. Scale bar, 500 µm. (c) Quantification of avidin staining assays shown in panel b. Results are expressed as number of mast cells normalized by flatmount area and presented as relative units (Gli1+/+, n = 3; Gli1GFP/GFP, n = 4; t test). **, P < 0.01. (d) Differential expression of melanocyte-enriched genes in RPE/choroid from Ihh+/+ and IhhiΔEC/iΔEC mice as determined by bulk RNAseq (n = 3, Benjamini–Hochberg corrected adj P < 0.05). (e) Serum-starved melan-a cells were grown in culture medium alone, culture medium supplemented with 100 nM SAG, or conditioned media (CM) from unstimulated or 100 nM SAG–treated GLI1+ cells. All conditions included 0.5% FBS. After 48 h, cell number was assessed and represented as the percentage of cells grown in normal melan-a culture medium with 10% FBS. Individual dots correspond to three independent experiments performed in biological triplicates, and red bars represent average values (n = 3, ANOVA + Bonferroni test). *, P < 0.05.

