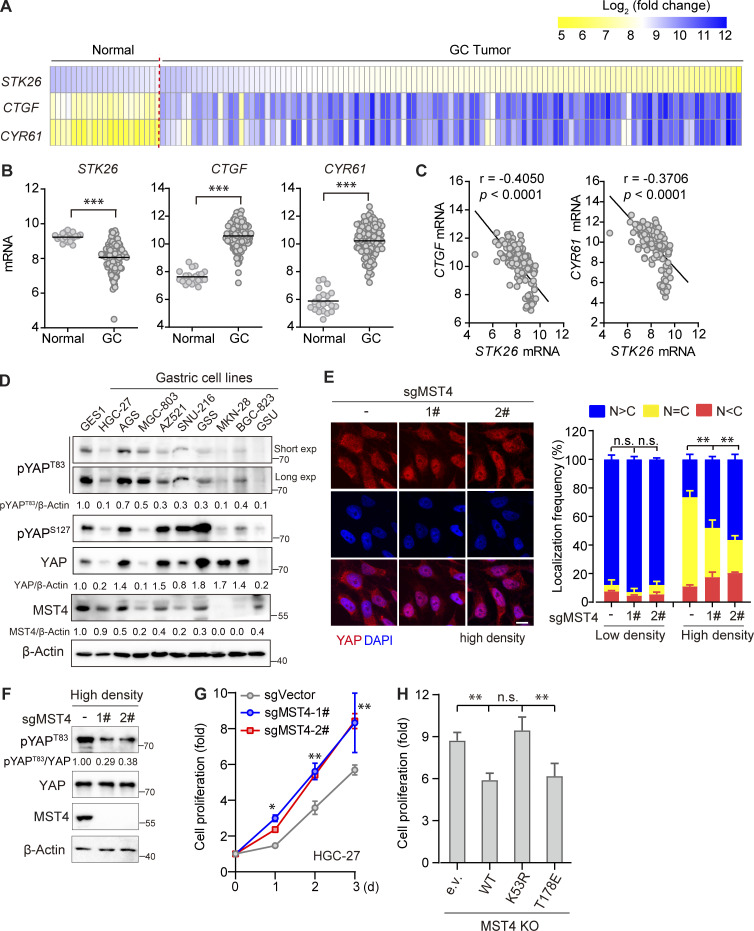
Figure 5.
MST4 limits YAP activation and cell proliferation in GC cells. (A and B) Analysis of STK26, CTGF, and CYR61 mRNA expression in published GC dataset. Heatmap demonstration (A), and statistical analysis (B) of the mRNA expression levels of STK26 and YAP target genes CTGF and CYR61 between healthy (n = 21) and GC tissue samples (n = 111) based on previously published microarray database (GEO accession no. GSE54129, ***, P < 0.001, unpaired t test). (C) STK26 mRNA expression negatively correlated with CTGF and CYR61 mRNA expression. Pearson’s correlation analysis between STK26 mRNA and YAP target genes CTGF and CYR61 was performed by GraphPad Prism 8.0 software. (D) The MST4–YAPT83 axis protein expression was down-regulated in GC cancer cells compared with normal gastric cells. Western blotting analysis of MST4, pYAPT83, pYAPS127, and YAP protein levels in normal and different GC cell lines (n = 2, quantification values represent the mean from two repeats). (E) MST4 depletion increases YAP nuclear localization in response to high cell density. HGC-27 cells (WT and MST4 KO) were seeded at high (90%) cell density for 24 h before processing for IFA assay using anti-YAP antibodies (scale bar, 5 µm, n = 3, n.s, not significant; **, P< 0.01; one-way ANOVA with Dunnett’s post hoc analysis, compared with control gRNA). (F) MST4 depletion reduced pYAPT83 levels in HGC-27 cells. High cell density (90%) of HGC-27 cells (WT and MST4 KO) were harvested for immunoblotting analysis using indicated antibodies (n = 3, quantification values represent the mean from three repeats). (G) MST4 deficiency stimulates GC cell proliferation. Cell proliferation curves of HGC-27 cells (WT and MST4 KOs) over the indicated time were measured by CellTiter Luminescent-based assay (four replicates per cell line for three repeats, *, P< 0.05; **, P< 0.01; two-way ANOVA with Tukey’s post hoc test). (H) MST4 limits cell proliferation requires its kinase activity. Quantification of cell proliferation rates of HGC-27 KO cell reconstituted with indicated constructs on day 3 were measured as in G (n = 3, n.s, not significant; **, P< 0.01; one-way ANOVA with Dunnett’s post hoc analysis, compared with vector control). Data are presented as the mean ± SEM. See also Fig. S4.

