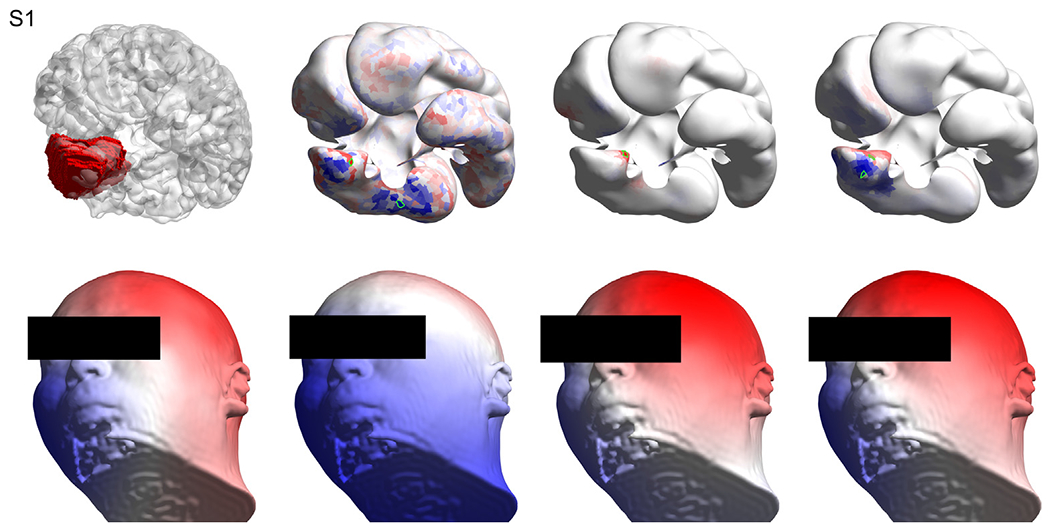
Fig. 3.

Results for subject S1. Top left: the volume of interest (in red) as marked by the neurosurgeon on the T1 image, overlaid with the wrinkled cortex. Top row, second, third and fourth columns show the solutions obtained with sLORETA, MSP and cMEM respectively, where the selected patches based on the best artificial versus real EEG match are highlighted in green. Bottom left: the interpolated (Oostendorp et al., 1989) real EEG on the scalp at the time point of interest. Bottom row, second, third and fourth columns show the artificial EEG modeled by placing dipoles centered at the patches marked in green in the top row for sLORETA, MSP and cMEM, respectively. Methods: standardized low-resolution brain electromagnetic tomography (sLORETA), multiple sparse priors (MSP) and coherent maximum entropy on the mean (cMEM). (For interpretation of the references to colour in this figure legend, the reader is referred to the web version of this article.)
