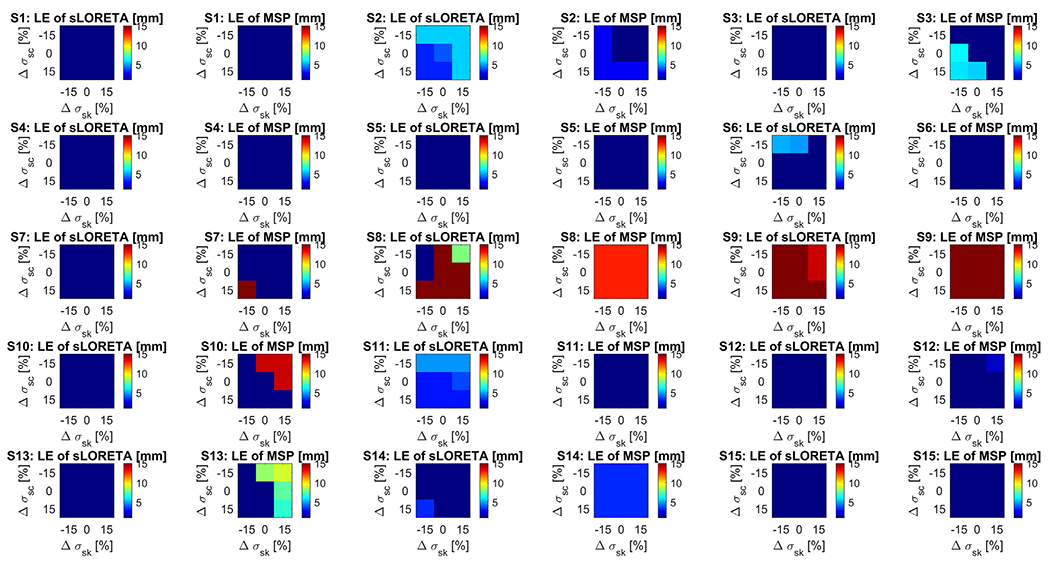
Fig. 7.

Localization errors (LE) when using deviations of the electrical conductivity. Each chart indicates the LE for each subject and each of the two source localization methods: sLORETA and MSP. Within each chart, the horizontal axis corresponds to −15%, 0% and 15% deviation of the skull conductivity with respect to the nominal (Δσsk) and the vertical axis corresponds to the −15%, 0% and 15% deviations of the scalp conductivity (Δσsc). Note that the central point of each chart indicates the LE using the nominal values for the scalp and skull conductivity values, that correspond to the values shown in Table 2. Methods: standardized low-resolution brain electromagnetic tomography (sLORETA), and multiple sparse priors (MSP). (For interpretation of the references to colour in this figure legend, the reader is referred to the web version of this article.)
