
FIGURE 5.
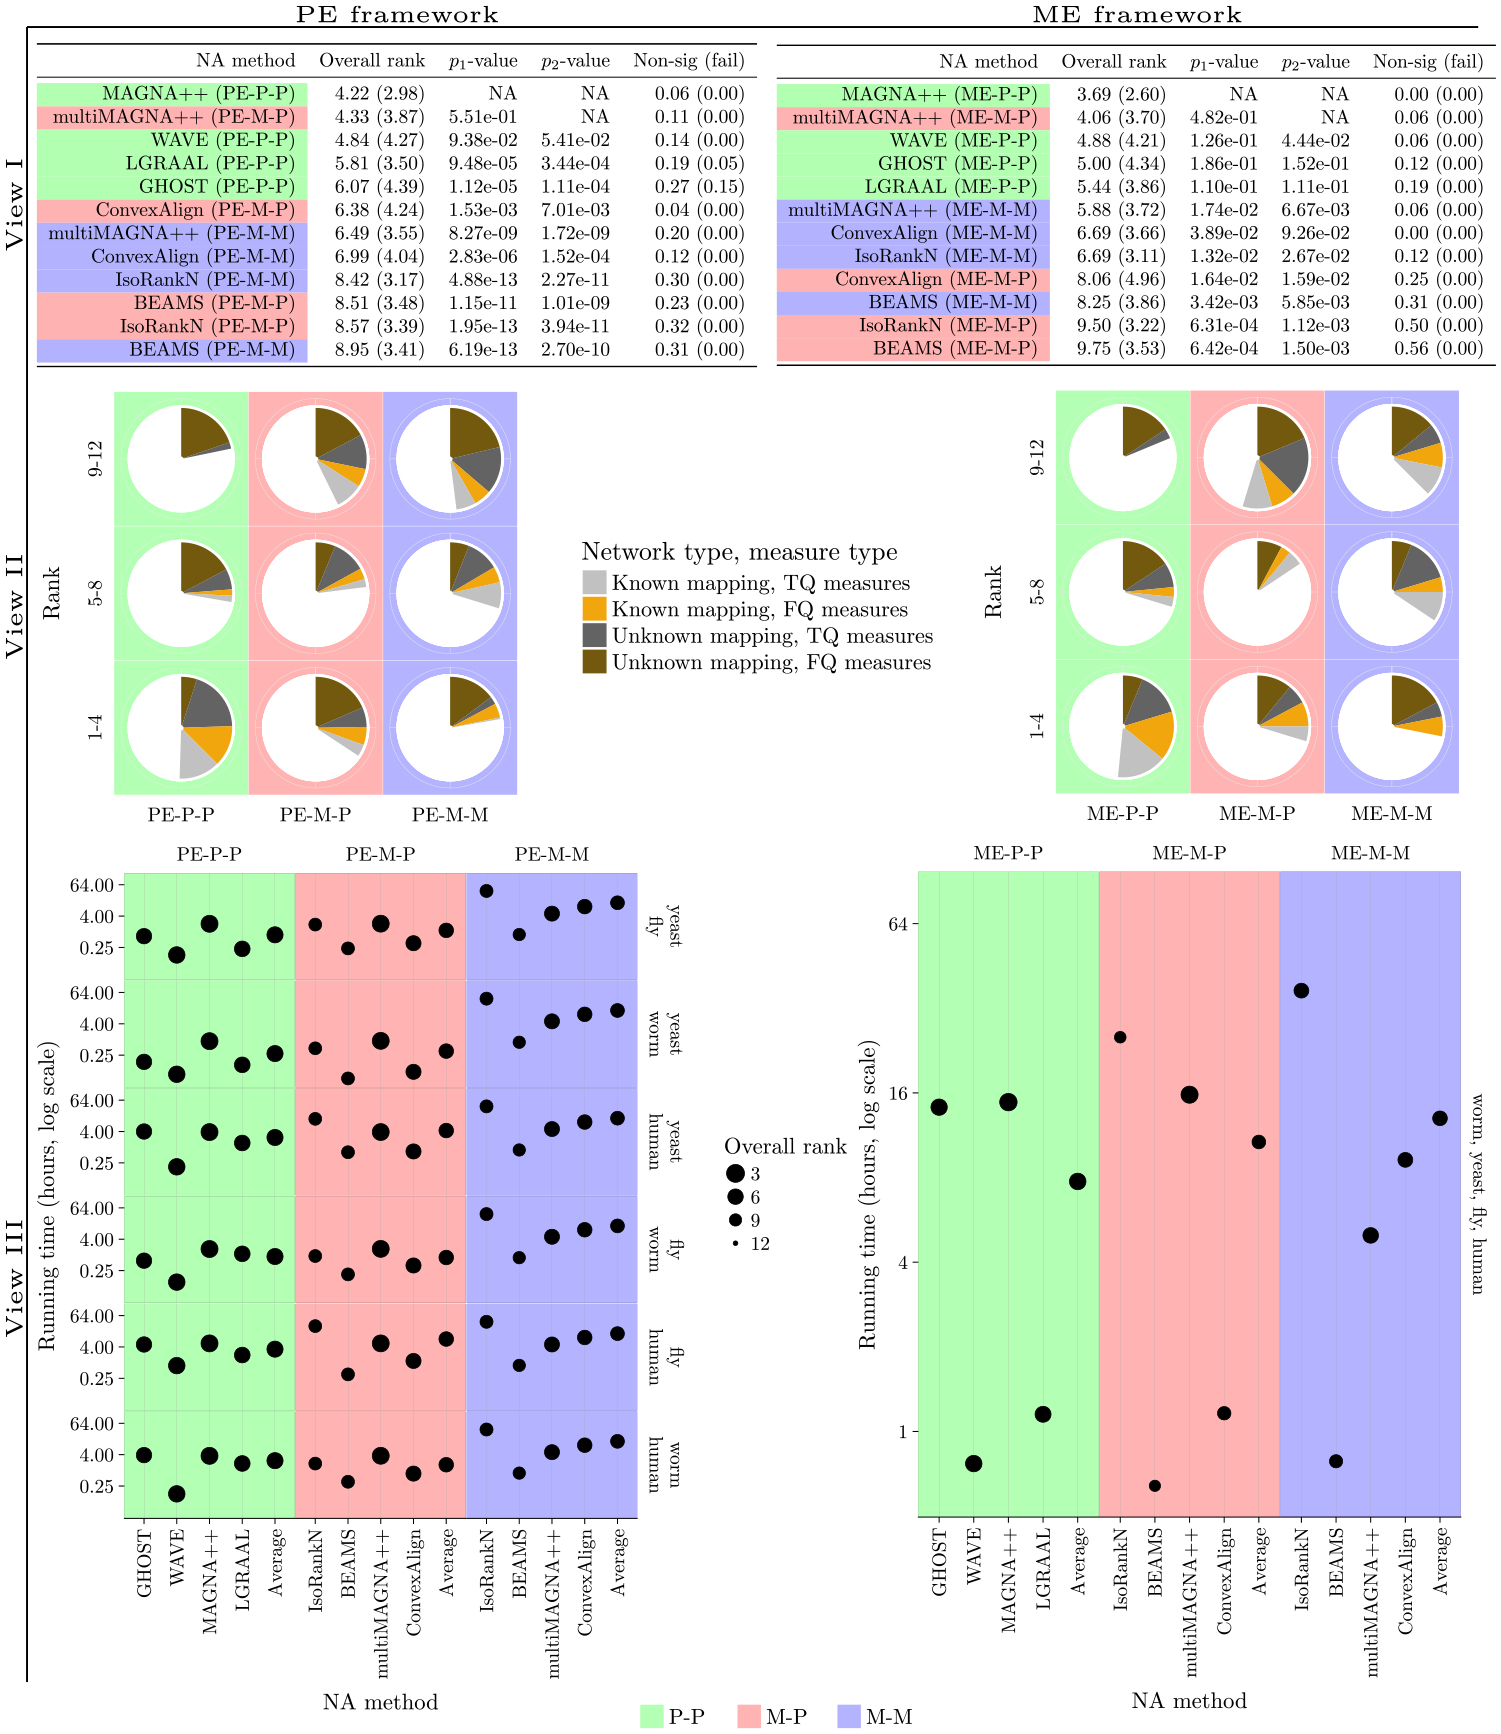
Alignment category comparison results for each of the PE and ME frameworks over all evaluation tests for T+S alignments. The alignment categories (i.e., PE-P-P, etc.) are color-coded. View I. Overall ranking of the NA methods. The “Overall rank” column shows the rank of each method averaged over all evaluation tests, along with the corresponding standard deviation (in brackets). View II. Alternative view of ranking of the NA methods. Each pie chart shows the fraction of evaluation test ranks that fall into the 1–4, 5–8, and 9–12 rank bins out of all evaluation test ranks in the given alignment category. The pie charts are color-coded with respect to alignments of network pairs/sets with known and unknown node mapping, and TQ and FQ measures. View III. Overall ranking of an NA method versus its running time for the Y2Hn1 network set. The size of each point visualizes the overall ranking of the corresponding method over all evaluation tests, corresponding to the “Overall rank” column in View I; the larger the point size, the better the method.