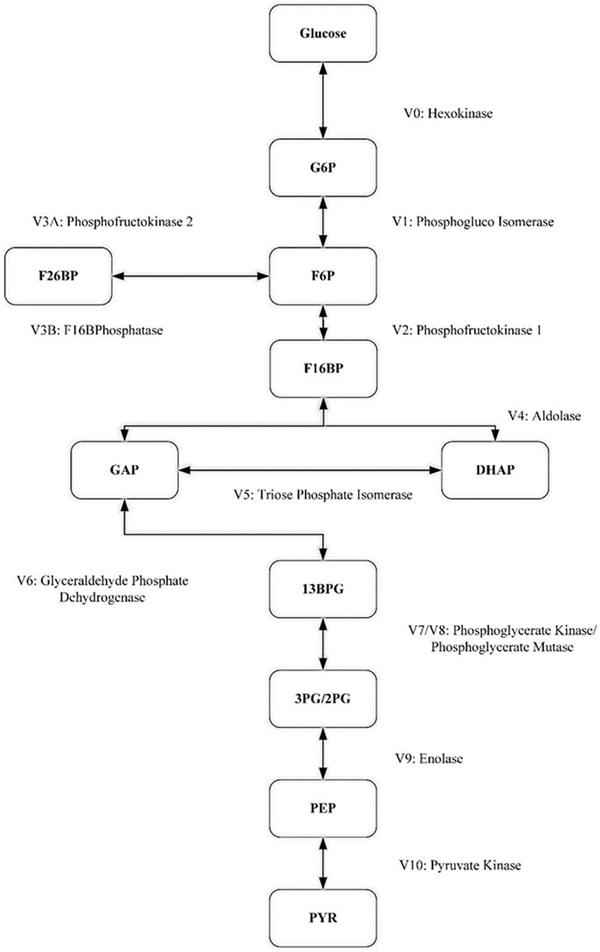
Fig. 2.
Simulated metabolic pathway from glucose to pyruvate. Arrows denote the modeled reactions. Vi, i = 0, …, 10, and V3A, V3B, are the reaction rates; for bidirectional arrows, the direction is determined by the sign of the corresponding reaction rate with the positive direction being from the top down. GLC, glucose; G6P, glucose 6-phosphate; F6P, fructose 6-phosphate; F16BP, fructose 1,6-bisphosphate; F26BP, fructose 2,6-bisphosphate; GAP glyceraldehyde 3-phosphate; DHAP, dihydroxyacetone phosphate; 13BPG, 1,3-bisphosphoglycerate; 3PG, 3-phosphoglycerate; 2PG, 2-phosphoglycerate; PEP, phosphoenolpyruvate; PYR, pyruvate.

