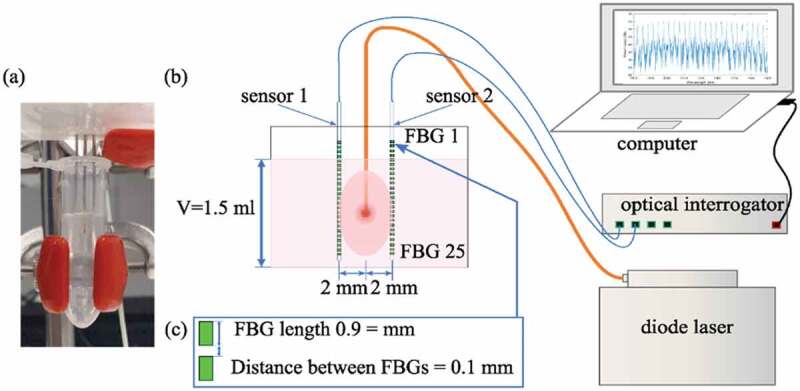
Figure 4.

Schematic overview of the experimental setup. (a) Digital photo showing the sample holding setup, (b) Temperatures measured by the FBG sensors at a 2 mm distance from the laser applicator and (c) Zoom-in of the schematic illustrating spatial characteristics of the sensors
