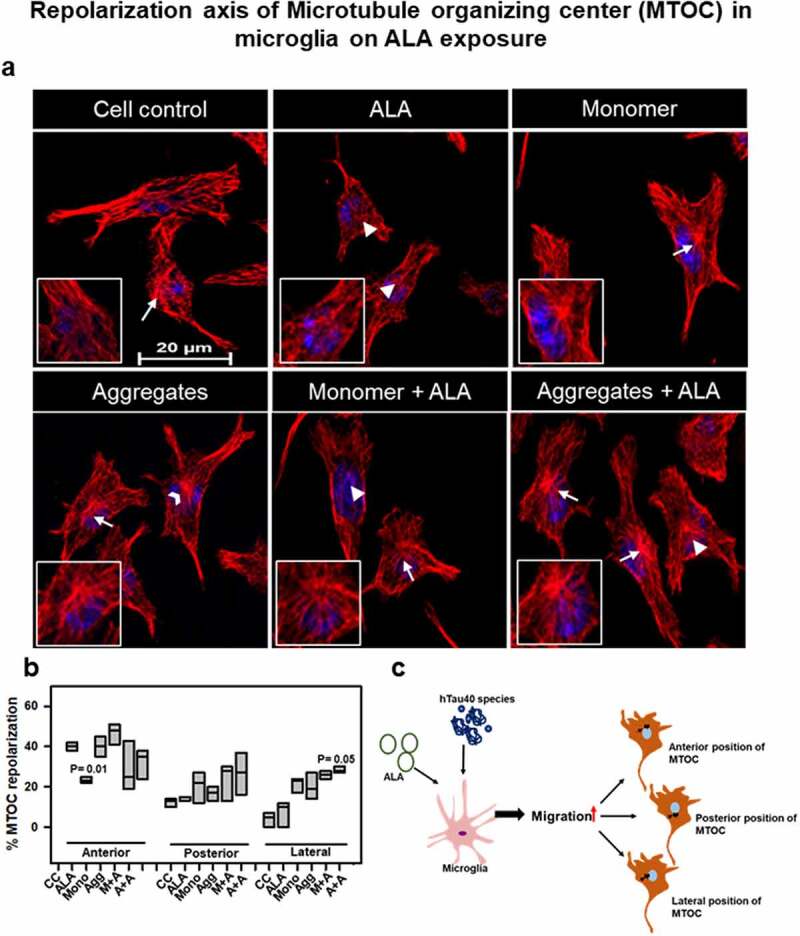
Figure 7.

Repolarization of axis of MTOC on ALA exposure. (a) Microglia were treated with hTau40 monomer, aggregates, and ALA for 24 h and observed for MTOC positioning with respect to nucleus in N9 cells. Fluorescence microscopy images were analyzed for MTOC positions stained with α-tubulin (red) and DAPI. The panels showing merge images with different MTOC position white triangle (anterior position), white open arrowhead (posterior position), and white arrow (lateral position). The inlet indicates the enlarged area showing MTOC in the cell. Scale bar is 20 µm. (b) Quantification of MTOC reorientation. The percentage number of cells for the different positions of MTOC was calculated in 10 different fields in all the treated groups. (c) Exposure of ALA with hTau40 monomer and aggregates was found to increase the migration that modulates the orientation of MTOC positions in the cells. The expected different positions of MTOC are depicted according to pectoral representation
