Figure 1.

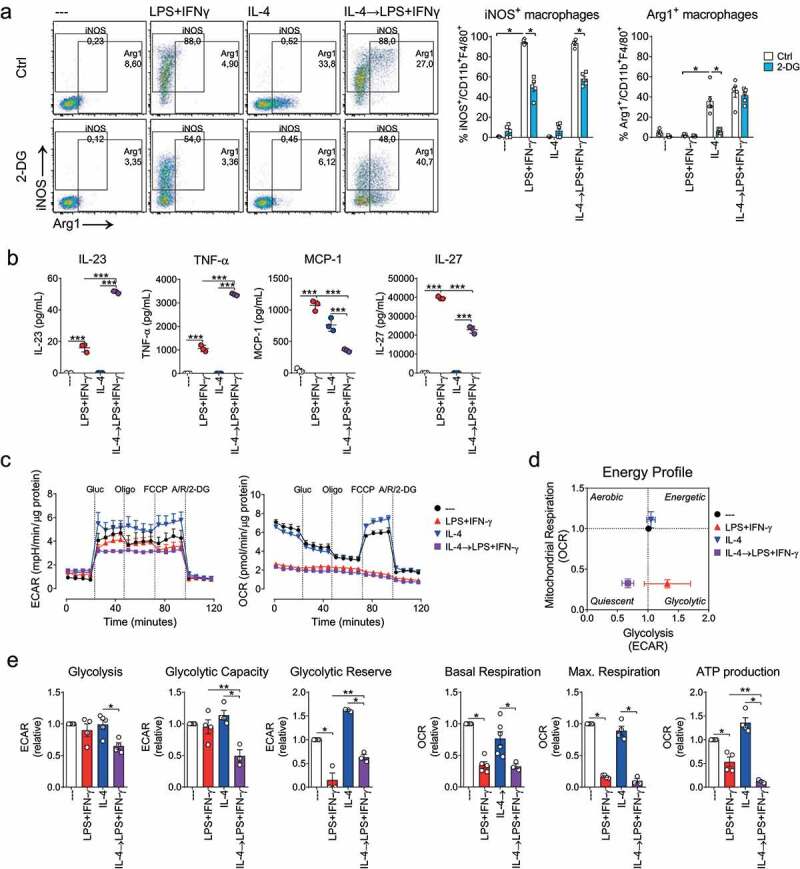
Macrophage repolarization depends on glycolysis and impairs mitochondrial respiration. Re-polarization scheme. BM-M were polarized using LPS+INF-γ (100 and 20 ng/ml, respectively) or IL-4 (20 ng/ml) (24 h). IL-4 macrophages were further re-polarized with LPS+IFN-γ (24 h). A, macrophages were (re)polarized in the presence or absence of 2-deoxiglucose (2-DG, 5 mM). iNOS and Arg1 expression was assessed by flow cytometry. Left, dot plots depicting gating strategy and population percentages of a typical experiment; right, iNOS+ or Arg1+ macrophage percentage (n = 5, two-way ANOVA followed by Fisher’s LSD post hoc). B, cytokine secretion in supernatant (cytokine bead array) (n = 3). C, metabolic profiles as determined by extracellular flux analysis (Seahorse XF). Extracellular acidification rate (ECAR, left) and mitochondrial oxygen consumption rates (OCR, right) were determined following the addition of glucose (Glu, 25 mM), oligomycin (Oligo, 1,5 µM), FCCP (1,5 µM) and Rotenone (Rot, 100 nM), antimycin A (AA,1 µM) and 2-DG (50 mg/ml). D, energy profile in the presence of glucose. E, calculated levels of glycolysis, glycolytic capacity and reserve, mitochondrial basal and maximal respiration, and ATP production (mean ± SEM, n = 3, paired one-way ANOVA followed by Fisher’s LSD test) (p values: * = p < .05, ** = p < .01 and *** = p < .001)
