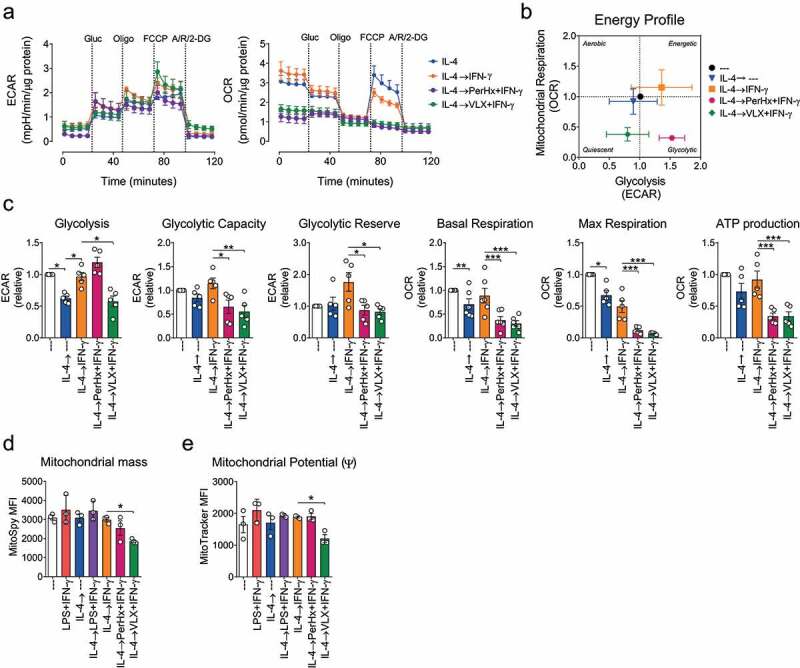
Figure 3.

Drug-mediated macrophage re-polarization impairs OXPHOS. BM-M were polarized with IL-4 (20 ng/ml, 24 h), washed and treated with PerHx (5 µM) or VLX (10 µM) after 1 h IFN-γ (20 ng/ml) was added for another 24 h. A, metabolic profile as determined by extracellular flux analysis. ECAR (left) and OCR (right) were determined following the addition of glucose (Glu, 25 mM), oligomycin (Oligo, 1,5 µM), FCCP (1,5 µM) and Rotenone (Rot, 100 nM), antimycin A (AA,1 µM) and 2-DG (50 mg/ml). B, energy profile in the presence of glucose. C, calculated levels of glycolysis, glycolytic capacity and reserve, mitochondrial basal and maximal respiration, and ATP production (n = 5). D, mitochondrial mass and E mitochondrial potential as determined by flow cytometry using MitoSpy Green FM and MitoTracker Red CMXRos, respectively (measured MFI is shown, n = 3). Bars represent the mean ± SEM. Data were analyzed by paired one-way ANOVA followed by Fisher’s LSD test (p values: * = p < .05, ** = p < .01 and *** = p < .001)
