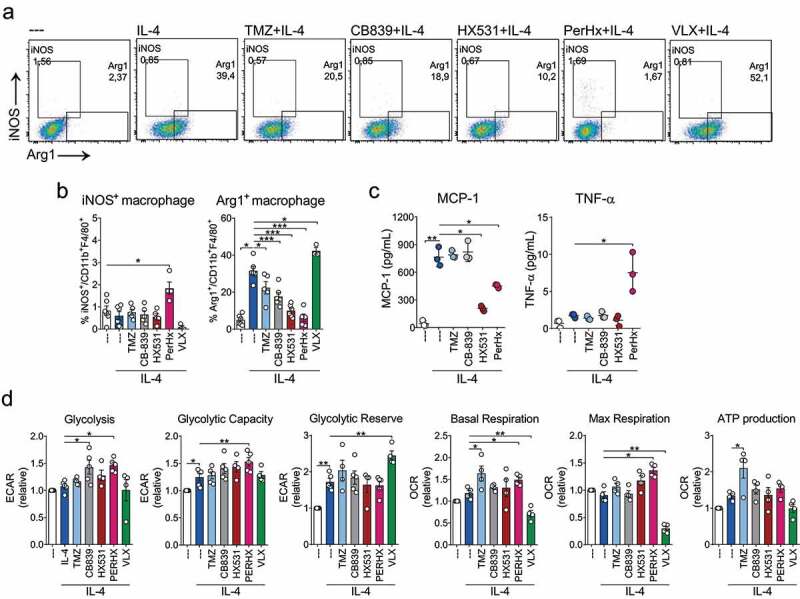
Figure 5.

Metabolic drugs prevent IL-4-mediated polarization. BM-M were treated with TMZ (100 µM), CB-839 (5 µM), HX531 (10 µM), PerHx (5 µM) and VLX (10 µM) for 1 h and then IL-4 (20 ng/ml) was added for 24 h. A, iNOS and Arg1 expression was assessed by flow cytometry. Dot plots depicting gating strategy and populations percentages. B, iNOS+ and Arg1+ macrophage percentages (n = 5). C, cytokines were evaluated from the supernatant by flow cytometry (beads array) (n = 3). D, metabolic profile as determined by extracellular flux analysis (Seahorse XF). Calculated levels of glycolysis, glycolytic capacity and reserve, mitochondrial basal and maximal respiration, and ATP production (n = 5) mean ± SEM, paired one-way ANOVA followed by Fisher’s LSD test, p values: * = p < .05, ** = p < .01 and *** = p < .001)
