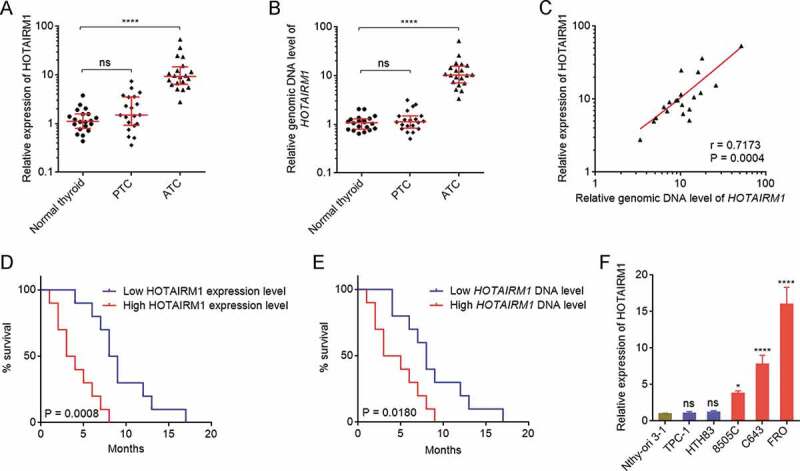
Figure 1.

The expression and genomic copy number of HOTAIRM1 in ATC. (A) HOTAIRM1 expressions in 20 normal thyroid tissues, 20 PTC tissues, and 20 ATC tissues were measured by RT-qPCR. GAPDH was used as endogenous control. Three randomly selected thyroid tissues were used as the reference samples to calculate the relative expressions. (B) Genomic copy numbers of HOTAIRM1 in 20 normal thyroid tissues, 20 PTC tissues, and 20 ATC tissues were measured by qPCR. LINE1 was used as endogenous control. Three randomly selected thyroid tissues were used as the reference samples to calculate the relative genomic copy numbers. For A-B, data were shown as median with interquartile range. ns, not significant, ****P < 0.0001 by Kruskal-Wallis test, followed by Dunn’s multiple comparisons test. (C) The correlation between HOTAIRM1 expression and genomic copy number of HOTAIRM1 in 20 ATC tissues. r = 0.7173, P = 0.0004 by Spearman correlation analysis. (D) Kaplan-Meier survival analyses of the correlation between HOTAIRM1 expression level and overall survival of ATC patients. n = 20, P = 0.0008 by log-rank test. HOTAIRM1 median expression level was used as cut-off. (E) Kaplan-Meier survival analyses of the correlation between HOTAIRM1 genomic copy number level and overall survival of ATC patients. n = 20, P = 0.0180 by log-rank test. HOTAIRM1 median copy number level was used as cut-off. (F) HOTAIRM1 expressions in normal thyroid follicular epithelial cell (Nthy-ori 3–1), PTC cells (TPC-1 and HTH83), and ATC cells (8505 C, C643, and FRO) were measured by RT-qPCR. GAPDH was used as endogenous control. Data were shown as mean ± standard deviation of three independent experiments. ns, not significant, *P < 0.05, ****P < 0.0001 by one-way ANOVA, followed by Dunnett’s multiple comparisons test
