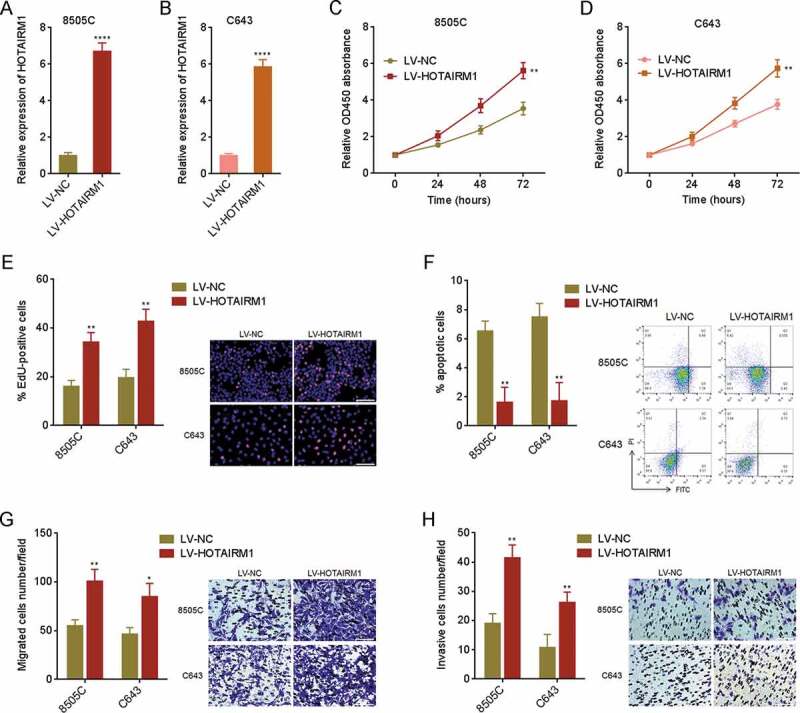
Figure 2.

The roles of HOTAIRM1 in proliferation, apoptosis, migration, and invasion of ATC cells. (A) HOTAIRM1 expressions in HOTAIRM1 overexpressed and control 8505 C cells were measured by RT-qPCR. GAPDH was used as endogenous control. (B) HOTAIRM1 expressions in HOTAIRM1 overexpressed and control C643 cells were measured by RT-qPCR. GAPDH was used as endogenous control. (C) Cell proliferation of HOTAIRM1 overexpressed and control 8505 C cells were measured by CCK-8 assays. Absorbance values at 450 nm were measured to track cell proliferation. (D) Cell proliferation of HOTAIRM1 overexpressed and control C643 cells were measured by CCK-8 assays. Absorbance values at 450 nm were measured to track cell proliferation. (E) Cell proliferation of HOTAIRM1 overexpressed and control 8505 C and C643 cells were measured by EdU incorporation assays. Red colour indicates EdU positive and proliferative cells. Scale bar = 100 μm. (F) Cell apoptosis of HOTAIRM1 overexpressed and control 8505 C and C643 cells were measured by Annexin-V-FITC/PI staining, followed by flow cytometry. (G) Cell migration of HOTAIRM1 overexpressed and control 8505 C and C643 cells were measured by transwell migration assays. Scale bar = 100 μm. (H) Cell invasion of HOTAIRM1 overexpressed and control 8505 C and C643 cells were measured by transwell invasion assays. Scale bar = 100 μm. Data were shown as mean ± standard deviation of three independent experiments. *P < 0.05, **P < 0.01, ****P < 0.0001 by Student’s t-test
