Figure 3.

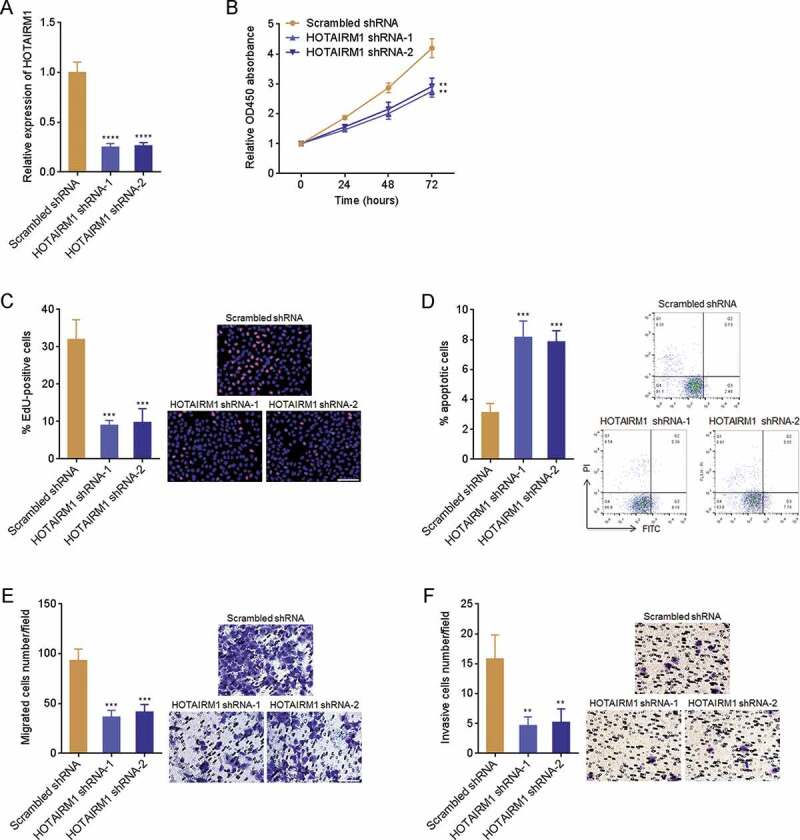
The roles of HOTAIRM1 knockdown in proliferation, apoptosis, migration, and invasion of ATC cells. (A) HOTAIRM1 expressions in HOTAIRM1 depleted and control FRO cells were measured by RT-qPCR. GAPDH was used endogenous control. (B) Cell proliferation of HOTAIRM1 depleted and control FRO cells were measured by CCK-8 assays. Absorbance values at 450 nm were measured to track cell proliferation. (C) Cell proliferation of HOTAIRM1 depleted and control FRO cells were measured by EdU incorporation assays. Red colour indicates EdU positive and proliferative cells. Scale bar = 100 μm. (D) Cell apoptosis of HOTAIRM1 depleted and control FRO cells were measured by Annexin-V-FITC/PI staining, followed by flow cytometry. (E) Cell migration of HOTAIRM1 depleted and control FRO cells were measured by transwell migration assays. Scale bar = 100 μm. (F) Cell invasion of HOTAIRM1 depleted and control FRO cells were measured by transwell invasion assays. Scale bar = 100 μm. Data were shown as mean ± standard deviation of three independent experiments. **P < 0.01, ***P < 0.001, ****P < 0.0001 by one-way ANOVA, followed by Dunnett’s multiple comparisons test
