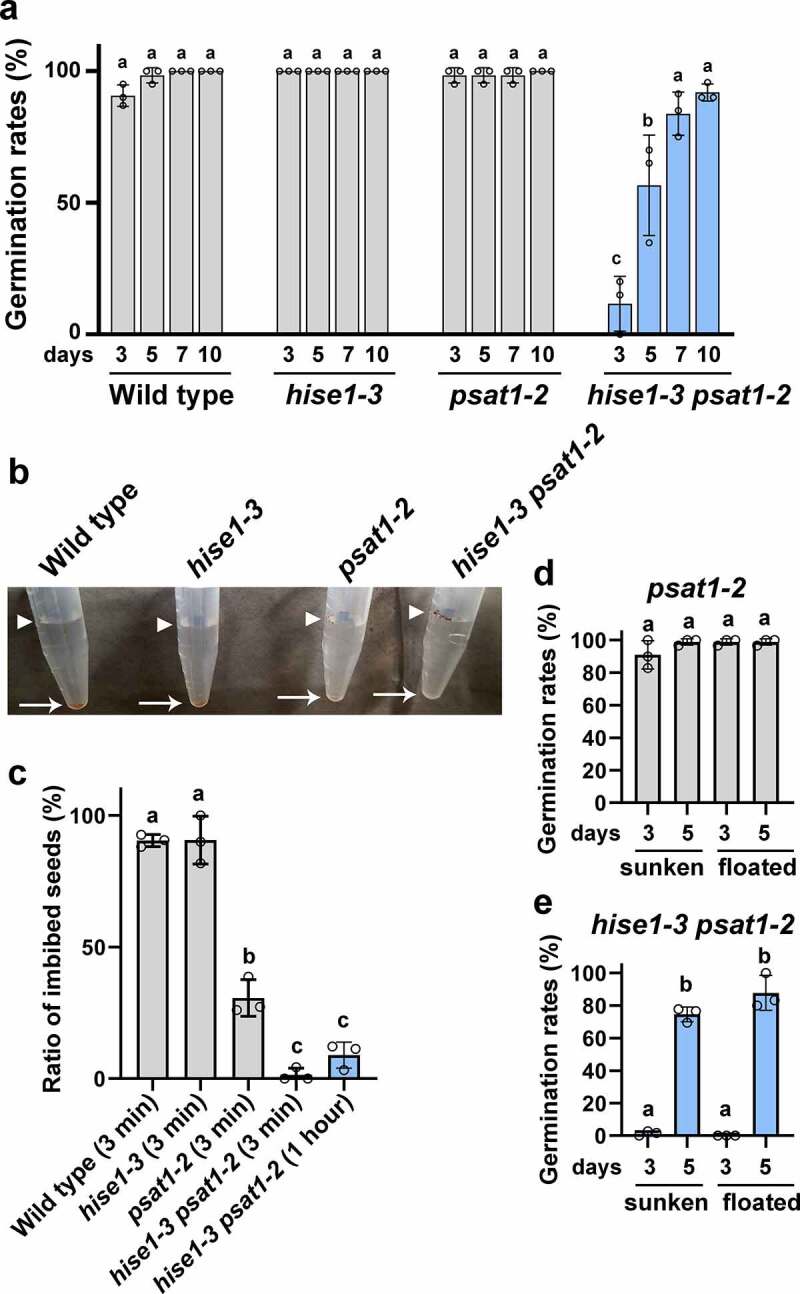
Figure 3.

Seeds of psat1-2 and hise1-3 psat1-2 exhibit defective seed imbibition. (a) Rates of seed germination at 3, 5, 7, and 10 days after sowing. Data represent the mean ± SD of three biological replicates (n = 3). Different letters indicate significant differences (p < .05; Tukey’s test). (b) A photograph showing seed imbibition at 3 min after imbibition. Arrowheads indicate un-imbibed seeds, which remained floating. Arrows indicate imbibed seeds that sunk to the bottom of the microtubes. (c) Rates of sunken seeds of wild-type, hise1-3, psat1-2, and hise1-3 psat1-2 at 3 min after imbibition, and rates of sunken seeds of hise1-3 psat1-2 at 1 h after imbibition. Data indicate the mean ± SD of three biological replicates (n = 3). Different letters indicate significant differences (p < .05; Tukey’s test). (d) Germination rates of sunken and floating seeds of psat1-2 at 3 and 5 days after sowing. Seeds of the psat1-2 mutant were divided into sunken and floating groups at 3 min after imbibition, and the germination rates were measured. Three biological replicates were performed. Data represent the mean ± SD (n = 3). Different letters indicate significant differences (p < .05; Tukey’s test). (e) Germination rates of sunken and floating seeds of hise1-3 psat1-2 at 3 and 5 days after sowing. Seeds of the hise1-3 psat1-2 double mutant were divided into sunken and floating groups at 1 h after imbibition, and the germination rates were measured. Three biological replicates were performed. Data represent the mean ± SD (n = 3). Different letters indicate significant differences (p < .05; Tukey’s test)
