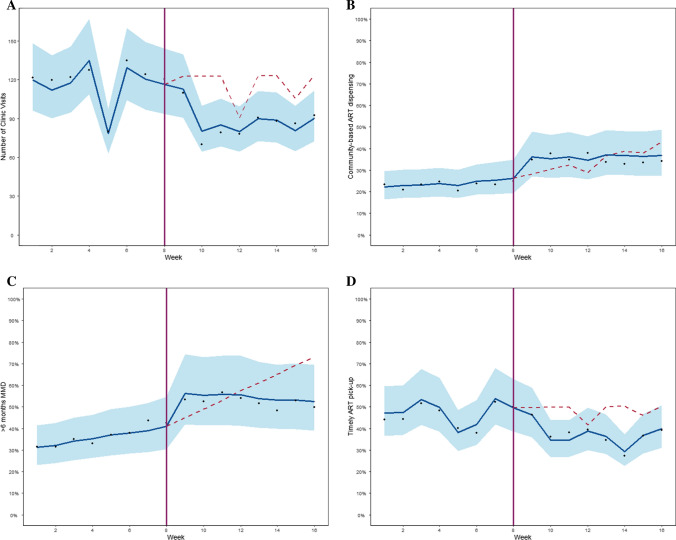
Fig. 1.
*Mean values by week shown with scatter points; blue trend line shows the ITS model-predicted trend with 95% confidence interval; vertical line shows the date of arrival of COVID-19 in Haiti (March 19 2020); dashed line show the counterfactual scenario of continuation of the before COVID-19 trend (with autoregression and adjustment for public holidays as a time-varying factor)

