Abstract
Background
Lower muscle mass is a known predictor of unfavorable outcome, but its prognostic impact on COVID-19 patients is unknown.
Purpose
To investigate the contribution of CT-derived muscle status in predicting clinical outcomes in COVID-19 patients.
Materials and Methods
Clinical/laboratory data and outcomes (intensive care unit [ICU] admission and death) were retrospectively retrieved for patients with reverse transcriptase polymerase chain reaction-confirmed COVID-19, who underwent chest CT on admission in four hospitals in Northern Italy from February 21 to April 30, 2020. Extent and type of pulmonary involvement, mediastinal lymphadenopathy, and pleural effusion were assessed. Cross-sectional areas and attenuation of paravertebral muscles were measured on axial CT images at T5 and T12 vertebral level. Multivariable linear and binary logistic regression, including calculation odds ratios (OR) with 95% confidence intervals (CIs), were used to build four models to predict ICU admission and death, tested and compared using receiver operating characteristic curve (ROC) analysis.
Results
A total 552 patients (364 men; median age 65 years, interquartile range 54–75) were included. In a CT-based model, lower-than-median T5 paravertebral muscle area showed the highest ORs for ICU admission (OR 4.8, 95% CI 2.7–8.5; P<.001) and death (OR 2.3, 95% CI 1.0–2.9; P=.027). When clinical variables were included in the model, lower-than-median T5 paravertebral muscle area still showed the highest ORs both for ICU admission (OR 4.3; 95% CI 2.5–7.7; P<.001) and death (OR 2.3, 95% CI 1.3–3.7; P=.001). At ROC analysis, the CT-based model and the model including clinical variables showed the same area under the curve (AUC) for ICU admission prediction (AUC 0.83, P=.380) and were not different in predicting death (AUC 0.86 versus AUC 0.87, respectively, P=.282).
Conclusion
In hospitalized patients with COVID-19, lower muscle mass on CT was independently associated with ICU admission and hospital mortality.
Summary
CT-derived muscle status allowed to predict clinical outcome (intensive care unit admission and death during hospitalization) in patients with COVID-19.
Key Results
■ At multivariable binary logistic regression on 552 COVID-19 patients with CTs performed on emergency department admission, lower-than-median T5 paravertebral muscle area yielded the highest significant odds ratios for intensive care unit admission admission (odds ratio 4.3, P<.001) and death (odds ratio 2.3, P=.001).
■ A combined model of CT-derived muscle status and lung disease extent allowed to predict death (area under the curve 0.81), without any increase in predictive performance when adding clinical data.
Introduction
The clinical picture of coronavirus disease 2019 (COVID-19), caused by infection with severe acute respiratory syndrome coronavirus 2 (SARS-CoV-2), includes fever, cough, dyspnea, fatigue, and myalgia, with possible evolution to severe pneumonia, acute respiratory distress syndrome, and even death (1). As suggested by recent studies, elderly patients and those with underlying comorbidities like heart or lung disease, obesity, and diabetes are at higher risk of developing severe complications (1,2). Lower muscle mass and sarcopenia, i.e. progressive loss of skeletal muscle mass and strength, are also generally encountered in elderly subjects (3) and are independent predictors of unfavorable outcome in trauma, cancer, chronic disease, and major surgery (3–7). Body composition might affect the clinical outcome of patients with pneumonia, as suggested by several authors (8,9) and proved by Buchman et al. (10), who identified an independent association with mortality in pneumonia patients for respiratory muscle strength and extremity muscle strength, coupled with and pulmonary function.
Among body composition parameters, visceral fat has been extensively shown to be an adverse outcome predictor in COVID-19 patients (11). Conversely, the postulated prognostic impact of lower muscle mass in COVID-19 patients (12) has only been preliminary evaluated (13,14), although it could be considered a proxy of the general health status and of the action of various typical comorbidities in elderly patients. If present, the exploitation of an association between muscle mass and outcomes in COVID-19 patients would rely on prompt identification of such a status, possibly even on emergency department admission, in order to aid patient stratification. Of note, information on muscle status could be easily retrieved by segmentation of specific skeletal muscle districts (4,7) on chest CT, which has been extensively used for patients’ triage and monitoring during the SARS-CoV-2 pandemic (15–20) – mainly to address the shortcomings of reverse transcriptase-polymerase chain reaction testing (15,18). Compared to detailed retrieval of comorbidities through history taking and to extensive laboratory panel tests, chest CT could therefore offer a two-sided approach for patient triage and management planning.
Thus, in this study we aimed to retrospectively investigate the potential contribution of CT-derived muscle status in predicting clinical outcomes in COVID-19 patients.
Materials and Methods
This multicenter retrospective observational study involved four hospitals in Northern Italy: Azienda Ospedaliero-Universitaria Maggiore della Carità, Novara (Center 1); ASST Grande Ospedale Metropolitano Niguarda, Milano (Center 2); Fondazione Poliambulanza Istituto Ospedaliero, Brescia (Center 3); IRCCS Istituto Ortopedico Galeazzi, Milano (Center 4). Approval from the Ethics Committee of each institution was obtained and specific informed consent was waived.
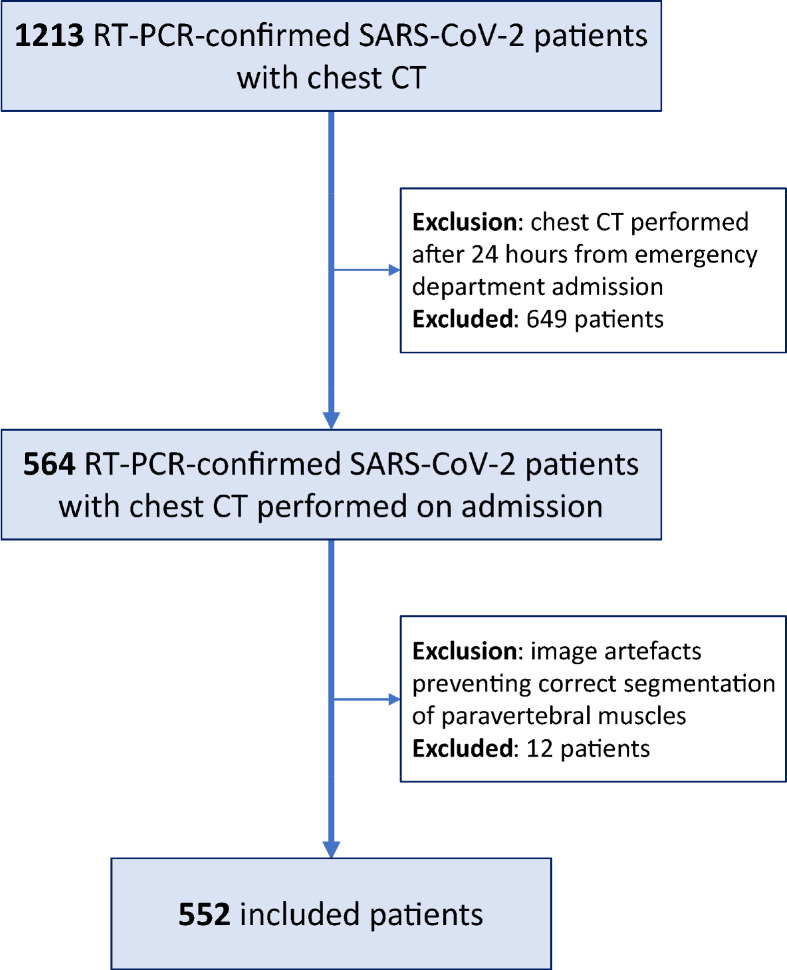
Consecutive hospitalized patients with reverse transcriptase-polymerase chain reaction-confirmed SARS-CoV- 2 infection who underwent chest CT within 24 hours from emergency department admission were included (Figure 1). Exclusion criteria subsequently applied regarded the presence of diseases which chronically impair muscular status (e.g., Duchenne’s dystrophy) or inadequate image quality of CT exams (e.g., presence of motion artefacts or spine implants) preventing adequate segmentation of paravertebral skeletal muscle area. Patient-specific data on emergency department admission were retrieved from electronic records (Table E1), including demographics, body mass index (BMI), symptoms, comorbidities, and laboratory tests, focusing on major negative clinical predictors for COVID-19 patients (21). Clinical outcomes, such as intensive care unit (ICU) admission and discharge or death, were retrospectively retrieved.
Figure 1:
Flow diagram of patients’ enrollment.
Image Acquisition and Analysis
All chest CTs were performed with the patient in supine position, during a single inspiratory breath-hold whenever possible. Technical characteristics of CT scanners and acquisition parameters for each center are listed in Table E2.
Image analysis was independently performed by four radiologists with an 8- to 15-year experience in chest imaging. Progression and extent of pulmonary parenchymal involvement were assessed by the radiologist on her/his own institutional picture archiving and communications system (PACS) viewer. Involvement progression was classified through a semiquantitative scale from 1 to 4, as absence of ground-glass opacities (GGOs) and consolidations (score 1), presence of GGOs alone (score 2), combination of GGOs and consolidations (score 3), consolidations alone (score 4). Disease extent was classified as proposed by Bernheim et al. (17): 0% (absent, 0); 1–25% (minimal, 1); 26–50% (mild, 2); 51–75% (moderate, 3); over 75% (severe, 4). Presence of crazy-paving pattern, mediastinal lymphadenopathy (i.e., the presence of at least one lymph node with short axis > 10 mm) (22), and pleural effusion was also recorded.
Skeletal muscle area was measured using each hospital PACS viewer tools. As previously reported (7,23), axial CT images at T5 and T12 vertebral levels were chosen to measure the electronic density expressed in Hounsfield units and cross-sectional areas of the paravertebral skeletal muscle mass (SMM) on both sides of the spine, considering: erector spinae muscle; longissimus thoracis muscle; spinalis thoracis muscle, iliocostalis lumborum muscle (7,24). To remove the effect of arm-related noise due to potential position of upper arms along the patient’s flanks, we normalized SMM density values by measuring aortic blood density at T5 and T12 levels.
Since direct measurement of height and weight was not available in all patients, we used vertebral size as a proxy of BMI for SMM area indexing (25). Measuring the anteroposterior diameter of T12 in an axial slice located in the middle of the vertebra, we estimated patients’ height and obtained dorsal muscle indexes (DMIT5 and DMIT12) by dividing SMM at T5 level (SMMT5) and at T12 level by the anteroposterior T12 vertebral size.
All skeletal muscle measurements and indexes were dichotomized as being over or under the median value of each variable distribution: patients with values over the median were considered to have a normal muscle status, whereas those with values under the median were considered as patients with lower muscle mass.
Statistical Analysis
Categorical variables were reported as numbers and percentages, continuous variables as mean and standard deviation or as median and interquartile range according to their distribution, assessed with the Shapiro-Wilk test.
To find potential associations between variables in predicting ICU admission and death during hospitalization, we first used univariate binary logistic regression to calculate unadjusted odds ratios (ORs) with their 95% confidence intervals (95% CIs) for each variable. We then aimed to compare outcome discrimination performance of four different models, all including sex, age and BMI, but each focusing on a different group of variables. Model 1 considered only clinical variables, Model 2 only muscle status, Model 3 muscle status and chest CT features, Model 4 clinical variables, muscle status, and chest CT features. A confirmatory model solely focused on chest CT features was also built to enable the comparison of the relative contributions of chest CT features and muscle status in outcome discrimination performance (Table E7–E8, Figures E1–E2). Variable selection for model building was performed with multivariable linear regression (backward elimination), after data imputation for missing values (mean replacement for continuous variables, nearest neighbor imputation for categorical variables, after random missingness hypothesis verification). Selected variables entered multivariable binary logistic regression, with calculation of adjusted ORs and their 95% CIs. Performance of the obtained models in predicting outcomes was assessed using receiver operating characteristic (ROC) curve analysis and area under the ROC curve (AUC) evaluation, AUCs being compared with the DeLong method (26).
Analyses were performed using SPSS v.26.0 (IBM SPSS Inc., Chicago, IL, USA), P values < .05 being considered statistically significant.
Results
Out of 564 patients with chest CT performed within 24 hours from admission at the four centers, 12 (2%) were excluded because their CT exams had inadequate image quality, while no patients were excluded for known diseases which chronically impair muscular status (Fig 1). As detailed in Table 1, a total 552 patients from the four centers were therefore included in this study, namely 270/552 (49%) from Center 1, 197/552 (36%) from Center 2, 54/552 (10%) from Center 3, and 31/552 (5%) from Center 4. Out of these 552 patients, 364/552 (66%) were men and 188/552 (34%) women, with an overall median age of 65 years (interquartile range 54–75). Patients were admitted to one of the four hospitals from February 21, 2020, to April 30, 2020, i.e. during the first SARS-CoV-2 pandemic peak in Northern Italy. Median hospitalization length was 7 days (interquartile range 5–13), and 92/552 patients (17%) were admitted to ICU during their hospital stay. For outcome assessment, censoring was applied on June 1, 2020, when all 552 patients had either been discharged (445/552 patients, 81%) or had died during hospitalization (107/552 patients, 19%).
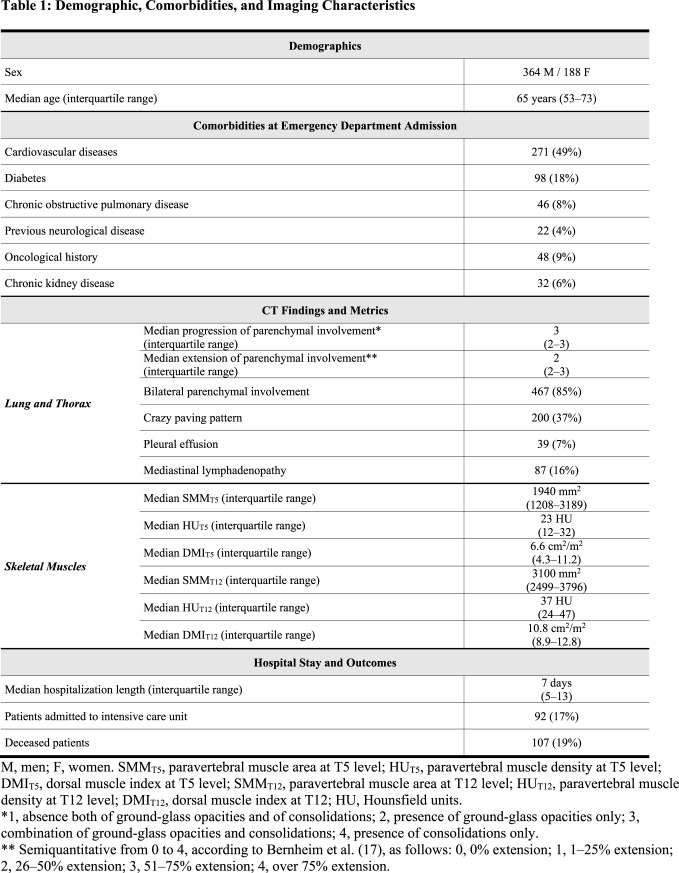
Table 1:
Demographic, Comorbidities, and Imaging Characteristics
On emergency department admission, fever was the most common symptom, affecting 437/552 patients (79%), followed by cough (318/552 patients, 58%) and dyspnea (244/552 patients, 44%). At least one comorbidity was found in 333/552 patients (60%), cardiovascular diseases being the most frequent (271/552 patients, 49%), followed by diabetes (98/552 patients, 18%). Overall median estimated height was 1.70 m (interquartile range 1.61–1.76 m). Weight was available for 138/552 patients (median 80 kg, interquartile range 70–90 kg), while a direct recording or calculation of BMI was available for 201/552 patients (median 26 kg/m2 interquartile range 24–30, normal BMI values for our population 18.5–25). Laboratory tests were available in all patients, with a median white blood cell count of 6.0×10³ per μl (interquartile range 4.5– 8.2×10³ per μl, reference range 4–11×103 per μl), a median lymphocyte count of 1.1×10³ per μl (interquartile range 0.8–1.4×10³ per μl, reference range 1–5×10³ per μl), and a median platelet count of 185×103 per μl (interquartile range 147–236×103 per μl, reference range 150–450×103 per μl).
CT Findings
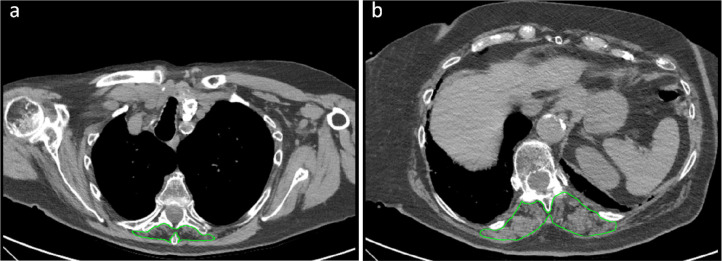
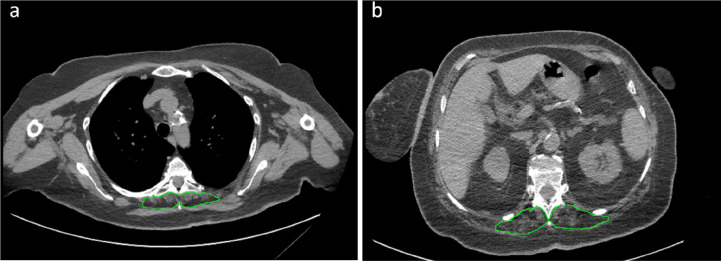
At chest CT performed on emergency department admission, parenchymal involvement had progressed only to GGOs without consolidations in 172/552 patients (31%), to GGOs with consolidations in 315/552 (57%), to consolidations without GGOs in 13/552 patients (2%). Minimal extension of parenchymal involvement was found in 133/552 (24%) patients, mild in 146/552 (26%), moderate in 158/552 (29%) and severe in 104/552 (19%). Other lung parenchymal, chest, and skeletal muscle features are detailed in Table 1. Two examples of patients where very low paravertebral SMMT5 and SMMT12 values contributed to the prediction of ICU admission and death are depicted in Figure 2 and Figure 3, respectively.
Figure 2:
Example of severely impaired muscle status with subsequent intensive care unit admission. Skeletal muscle area segmentation on chest CT images at T5 level (panel a) and T12 level (panel b) of a 79 years old female COVID-19 patient. This patient presented with fever, cough, mild bilateral lung parenchymal involvement (category 2 according to Bernheim et al. (17)), coexistence of ground-glass opacities and consolidations, no evidence of crazy paving, pleural effusion, or mediastinal lymphadenopathy. She had no comorbidities and no abnormalities in all considered laboratory tests (white blood cell count, lymphocyte count, platelet count). Muscle status parameters were however all impaired save for dorsal muscle index at T12 level: T5 paravertebral muscle area (890 mm2), T5 paravertebral muscle density (8 Hounsfield units), T5 dorsal muscle index (6.6 cm2/m2), T12 paravertebral muscle area (2440 mm2), and T12 paravertebral muscle density (5 Hounsfield units) were all in the lowest quartile of their overall distributions.
Figure 3:
Example of severely impaired muscle status with subsequent intensive care unit admission and death. Skeletal muscle area segmentation on chest CT images at T5 level (panel a) and T12 level (panel b) of a 62 years old female COVID-19 patient. This patient presented with fever, dyspnea, mild bilateral lung parenchymal involvement (category 2 according to Bernheim et al. (17)), consolidations without groundglass opacities, no evidence of crazy paving, pleural effusion, or mediastinal lymphadenopathy. She had previous cardiovascular comorbidities, diabetes, and class I obesity. All considered laboratory tests (white blood cell count, lymphocyte count, platelet count) were within normal ranges. Muscle status parameters were however all impaired: T5 paravertebral muscle area (750 mm2), T5 paravertebral muscle density (10 Hounsfield units), T5 dorsal muscle index (2.9 cm2/m2), T12 paravertebral muscle area (2300 mm2), T12 paravertebral muscle density (5 Hounsfield units), and T12 dorsal muscle index (6.7 cm2/m2) were all in the lowest quartile of their overall distributions, with marked fatty degeneration both at T5 and T12 levels.
Regression Analyses
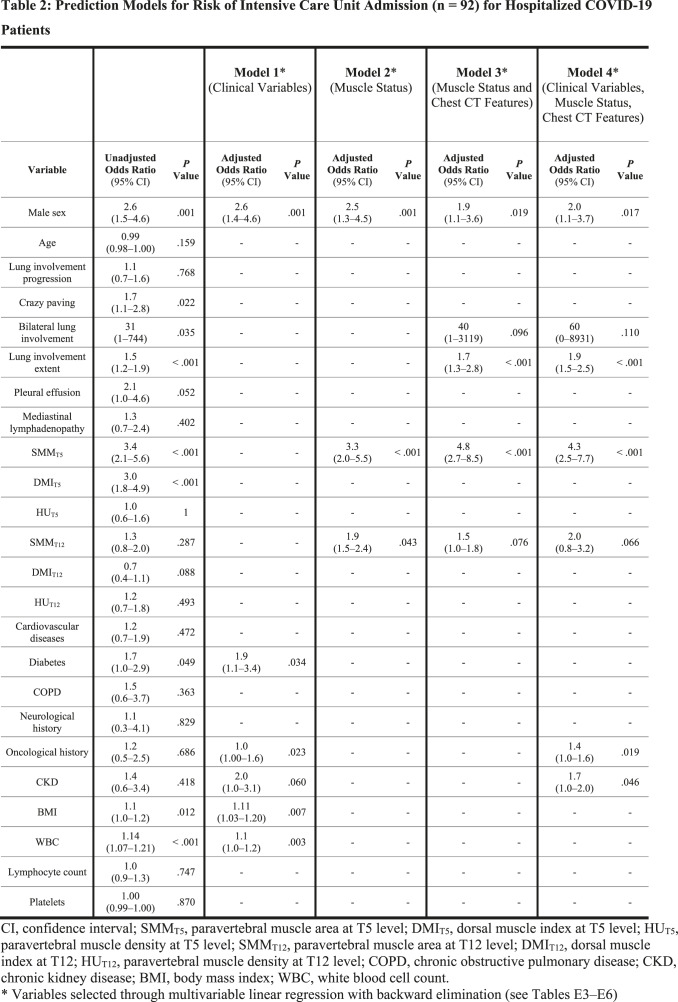
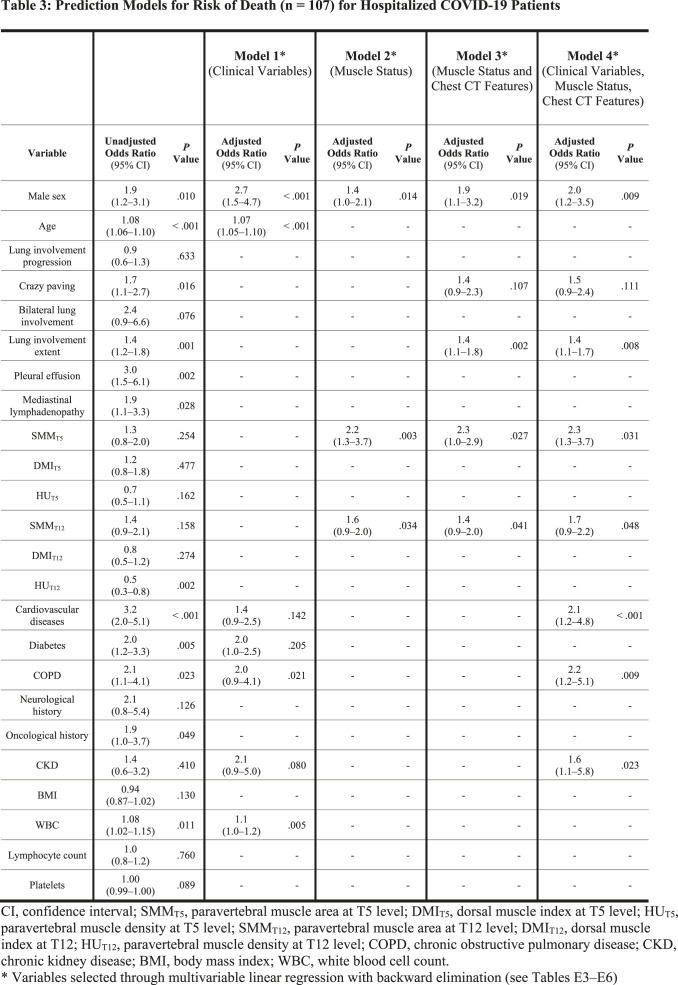
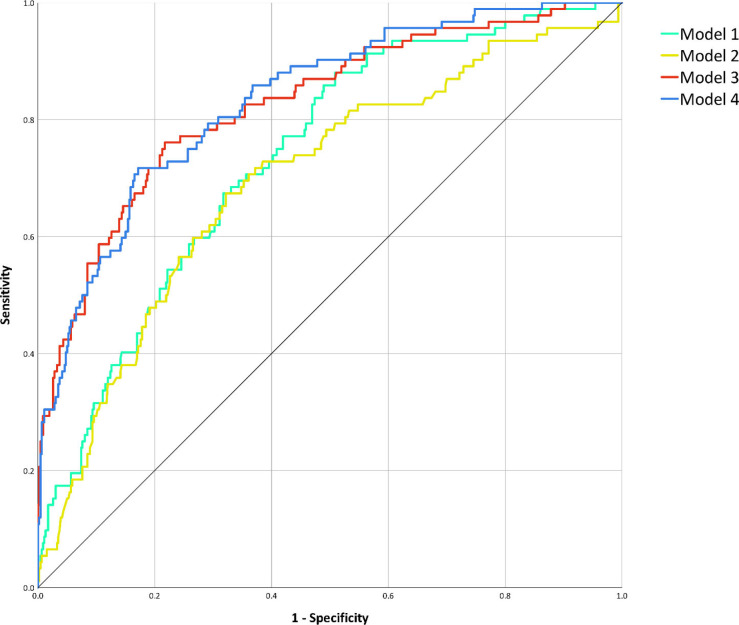
For each variable, unadjusted ORs for ICU admission and death from univariate binary logistic regression are presented in the first columns of Table 2 and Table 3, respectively. Details of model building through multivariable linear regression are shown in Tables E3–E6: variables selected by backward elimination entered multivariable binary logistic regression, with calculation of adjusted ORs for the four predictive models for ICU admission (Table 2) and the four predictive models for death (Table 3). Among muscle status parameters, multivariable linear regression selected paravertebral SMMT5 and SMMT12 as predictors of ICU admission and death in all models involving muscle status (Model 2, Model 3, and Model 4). At multivariable logistic regression on Model 3 (muscle status and chest CT features), paravertebral SMMT5 had the highest statistically significant OR both for ICU admission (OR 4.8; 95% CI 2.7–8.5; P < .001) and death (OR 2.3; 95% CI 1.0–2.9; P = .027), such findings being mirrored in Model 4 (clinical variables, muscle status, and chest CT features) where paravertebral SMMT5 also had the highest statistically significant OR both for ICU admission (OR 4.3; 95% CI 2.5–7.7; P < .001) and death (OR 2.3; 95% CI 1.3–3.7; P = .001). Among models considering only a category of features, ROC analysis for the prediction of ICU admission (Fig 4) found an AUC of 0.74 (95% CI 0.68–0.79; P < .001) for Model 1, an AUC of 0.70 (95% CI 0.64– 0.76; P < .001) for Model 2, while for combined models we obtained an AUC of 0.83 for Model 3 (95% CI 0.78–0.87; P < .001) and an AUC of 0.83 for Model 4 (95% CI 0.79–0.88; P < .001). AUC comparison showed no significant differences between AUCs of Model 1 and Model 2 (P = .217), whose performances were however significantly inferior to those of Model 3 and Model 4 (P < .001). No significant difference was found between the AUCs of Model 3 and Model 4 (P = .380).
Table 2:
Prediction Models for Risk of Intensive Care Unit Admission (n = 92) for Hospitalized COVID-19 Patients
Table 3:
Prediction Models for Risk of Death (n = 107) for Hospitalized COVID-19 Patients
Figure 4:
Receiver operating characteristic curve analysis for the prediction of intensive care unit admission. After performing area under the curve comparison with the DeLong method, discrimination performances of Model 1 (clinical variables, area under the curve 0.74, 95% confidence interval 0.68–0.79, P < .001) did not significantly differ from those of Model 2 (muscle status, area under the curve 0.70, 95% confidence interval 0.64–0.76, P < .001; area under the curve comparison for Model 1 against Model 2: P = .217), nor did the ones of Model 3 (muscle status and chest CT features, area under the curve 0.83, 95% confidence interval 0.78–0.87, P < .001) and of Model 4 (clinical variables, muscle status, and chest CT features, area under the curve 0.83, 95% confidence interval 0.79–0.88, P < .001; area under the curve comparison against Model 3: P = .380). However, as depicted, both Model 1 and Model 2 discrimination performances were significantly inferior to those of Model 3 and Model 4 (all area under the curve comparisons: P < .001).
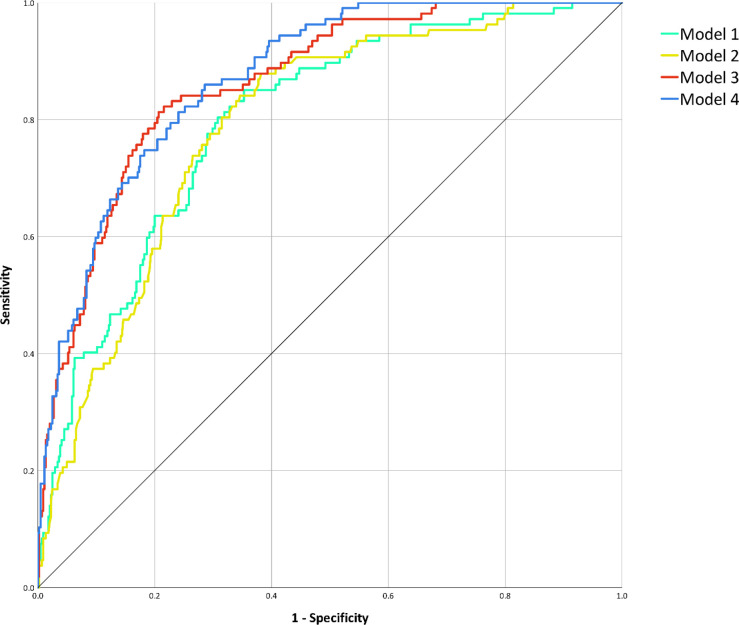
ROC analysis for the prediction of death (Fig 5) among models considering only a category of features found an AUC of 0.80 (95% CI 0.75–0.84; P < .001) for Model 1, an AUC of 0.79 (95% CI 0.75–0.83; P < .001) for Model 2, while for combined models we obtained an AUC of 0.86 for Model 3 (95% CI 0.83–0.90; P < .001) and an AUC of 0.87 for Model 4 (95% CI 0.84–0.91; P < .001). AUC comparison showed no significant differences between Model 1 and Model 2 AUCs (P = .599), whose performances were however significantly inferior to those of Model 3 and Model 4 (P < .001), between which no significant difference was detected (P = .282).
Figure 5:
Receiver operating characteristic curve analysis for the prediction of death during hospitalization. After performing area under the curve comparison with the DeLong method, discrimination performances of Model 1 (clinical variables, area under the curve 0.80, 95% confidence interval 0.75–0.84, P < .001) did not significantly differ from those of Model 2 (muscle status, area under the curve 0.79, 95% confidence interval 0.75–0.83, P < .001; area under the curve comparison for Model 1 against Model 2: P = .599), nor did the ones of Model 3 (muscle status and chest CT features, area under the curve 0.86, 95% confidence interval 0.83–0.90, P < .001) and of Model 4 (clinical variables, muscle status, and chest CT features, area under the curve 0.87, 95% confidence interval 0.84–0.91, P < .001; area under the curve comparison against Model 3: P = .282). However, as depicted, both Model 1 and Model 2 discrimination performances were significantly inferior to those of Model 3 and Model 4 (all area under the curve comparisons: P < .001).
Discussion
In this retrospective multicenter study on the prognostic role of lower muscle mass in COVID-19 patients, we evaluated 552 patients from four institutions in Northern Italy that admitted and treated patients during the first SARS-CoV-2 pandemic peak between February 21 and April 30, 2020. Our main finding was the association between lower-than-median paravertebral muscle mass measured on chest CT performed on admission and adverse outcome of COVID-19 patients during the first pandemic peak. In multivariable logistic regression models considering clinical variables, chest CT features, and muscle status, lower-thanmedian paravertebral muscle area at T5 level yielded the highest odds ratio for intensive care unit admission (4.34; P < .001) and death (2.28; P = .001). A model combining CT-derived muscle status and lung disease extent allowed to predict death (area under the curve 0.86), without any increase from the addition of clinical data.
In COVID-19 patients, advanced age and various pre-existing comorbidities have been associated with higher risk of death (1,2,21,27,28). While the same has been documented for pulmonary parenchymal damage and associated pathologic features assessed on chest CT (19,22,29), few articles have investigated whether sarcopenia and lower muscle mass are negative predictors for severe COVID-19 (12–14). Nevertheless, impaired muscle status has long been associated with higher mortality risk in critical care: sarcopenia and lower muscle mass – detected by CT – are primary predictors of worse outcome in mechanically ventilated patients (30–32).
Our study confirmed the negative prognostic role played in COVID-19 patients by age, comorbidities, and some of the chest CT features already recognized as adverse outcome predictors (27). Furthermore, we extended such prognostic evaluation to impaired muscle status, that proved to be the strongest CT-derived independent predictor of both ICU admission and death. Lower muscle mass probably impacts on respiratory muscles function, alongside other mechanisms involving global sarcopenia (12–14), such as the sarcopeniainduced pro-inflammatory profile (28), interplaying with the cytokine storm triggered by SARS-CoV-2 (33,34), prolonged immobilization during hospitalization, and mechanical ventilation (12–14).
If a strong association between lower muscle mass and worse outcome of COVID-19 patients will be confirmed by further studies, the role of chest CT could expand from triage and monitoring applications to prognosis prediction. Since chest CT is effectively used to detect and stage COVID-19 pneumonia (15,18–20), CT exams can also be used to identify patients with lower muscle mass at higher risk of worse outcome, achieving a simultaneous diagnostic and prognostic assessment. Our study showed how the prognostic performance of a model relying only on chest CT-derived features (lung parenchyma and muscle status) equals the one of models including also clinical variables, which, of note, are relatively more difficult and time-consuming to retrieve. The application of artificial intelligence to both lung and muscle status assessment on chest CT images could further curtail the time needed to obtain such prognostic information, this approach being already proposed for muscle status assessment on abdominal CT scans (35).
Some limitations of our study should be considered, other than its retrospective nature. First, these results were obtained during a pandemic peak, with high disease prevalence and severity. Therefore, the prognostic role of sarcopenia in COVID-19 patients must be verified in different study periods with lower disease prevalence and/or severity, also considering that effective therapies have been introduced. Second, from a technical point of view, arm-related noise due to the position of upper arms along patient’s flanks could have affected the attenuation values of paravertebral muscles. This could partly justify the absent association of low muscle density with worse outcome, although we tried to remove this effect by normalizing paravertebral muscles attenuation values with those of aortic content. Since a correlation between skeletal muscle density and mortality in mechanically ventilated patients has been previously reported (31), this point deserves further investigation. Third, height of all patients was not available, thus we had to estimate the height of part of our patients by the anteroposterior diameter of T12, as previously validated (25). Fourth, our study retrieved data from multiple centers with different CT acquisition parameters and potentially different ICU admission criteria for COVID-19 patients. Similarly, image analysis was performed by different readers with different experience, although on standardized criteria. Fifth, pulmonary vascular damage has been progressively recognized as a major influence on COVID-19 prognosis (20). Its inclusion could have further refined the performance of our predictive model, but all our patients were admitted and treated in the first pandemic peak in the first-hit European region, when evidence on this issue was still scarce and routine evaluation of coagulation parameters was far from being implemented.
In conclusion, a chest CT-based combined model integrating muscle status allowed to reliably predict ICU admission and death in COVID-19 patients without relevant contribution from clinical variables, highlighting the need to consider previously overlooked frailty indicators in COVID-19 diagnostic and therapeutic pathways.
S. Schiaffino and D. Albano contributed equally to this work.
Abbreviations:
- COVID-19
- Coronavirus Disease 2019
- SARS-CoV-2
- Severe Acute Respiratory Syndrome Coronavirus 2
- ICU
- Intensive Care Unit
- GGOs
- Ground-glass Opacities
- SMM
- Skeletal Muscle Mass
- DMI
- Dorsal Muscle Index
- OR
- Odds Ratio
- CI
- Confidence Interval
- ROC
- Receiver Operating Characteristics
- AUC
- Area Under the Curve
References
- 1.Verity R, Okell LC, Dorigatti I, et al. Estimates of the severity of coronavirus disease 2019: a model-based analysis. Lancet Infect Dis 2020;669–677. doi: 10.1016/S1473-3099(20)30243-7 [DOI] [PMC free article] [PubMed] [Google Scholar]
- 2.Guo T, Shen Q, Guo W, et al. Clinical Characteristics of Elderly Patients with COVID-19 in Hunan Province, China: A Multicenter, Retrospective Study. Gerontology 2020;467–475. doi: 10.1159/000508734 [DOI] [PubMed] [Google Scholar]
- 3.Calvani R, Marini F, Cesari M, et al. Biomarkers for physical frailty and sarcopenia: state of the science and future developments. J Cachexia Sarcopenia Muscle 2015;278–286. doi: 10.1002/jcsm.12051 [DOI] [PMC free article] [PubMed] [Google Scholar]
- 4.Albano D, Messina C, Vitale J, Sconfienza LM. Imaging of sarcopenia: old evidence and new insights. Eur Radiol 2020;2199–2208. doi: 10.1007/s00330-019-06573-2 [DOI] [PubMed] [Google Scholar]
- 5.Boutin RD, Katz JR, Chaudhari AJ, et al. Association of adipose tissue and skeletal muscle metrics with overall survival and postoperative complications in soft tissue sarcoma patients: an opportunistic study using computed tomography. Quant Imaging Med Surg 2020;1580–1589. doi: 10.21037/qims.2020.02.09 [DOI] [PMC free article] [PubMed] [Google Scholar]
- 6.Giraudo C, Cavaliere A, Lupi A, Guglielmi G, Quaia E. Established paths and new avenues: a review of the main radiological techniques for investigating sarcopenia. Quant Imaging Med Surg 2020;1602–1613. doi: 10.21037/qims.2019.12.15 [DOI] [PMC free article] [PubMed] [Google Scholar]
- 7.Troschel AS, Troschel FM, Best TD, et al. Computed Tomography–based Body Composition Analysis and Its Role in Lung Cancer Care. J Thorac Imaging 2020;91–100. doi: 10.1097/RTI.0000000000000428 [DOI] [PubMed] [Google Scholar]
- 8.Okazaki T, Ebihara S, Mori T, Izumi S, Ebihara T. Association between sarcopenia and pneumonia in older people. Geriatr Gerontol Int 2020;7–13. doi: 10.1111/ggi.13839 [DOI] [PubMed] [Google Scholar]
- 9.Maeda K, Akagi J. Muscle Mass Loss Is a Potential Predictor of 90-Day Mortality in Older Adults with Aspiration Pneumonia. J Am Geriatr Soc 2017;e18–e22. doi: 10.1111/jgs.14543 [DOI] [PubMed] [Google Scholar]
- 10.Buchman AS, Boyle PA, Wilson RS, Gu L, Bienias JL, Bennett DA. Pulmonary function, muscle strength and mortality in old age. Mech Ageing Dev 2008;625–631. doi: 10.1016/j.mad.2008.07.003 [DOI] [PMC free article] [PubMed] [Google Scholar]
- 11.de Siqueira JVV, Almeida LG, Zica BO, Brum IB, Barceló A, de Siqueira Galil AG. Impact of obesity on hospitalizations and mortality, due to COVID-19: A systematic review. Obes Res Clin Pract 2020;398–403. doi: 10.1016/j.orcp.2020.07.005 [DOI] [PMC free article] [PubMed] [Google Scholar]
- 12.Ekiz T, Kara M, Özcan F, Ricci V, Özçakar L. Sarcopenia and COVID-19. Am J Phys Med Rehabil 2020;880–882. doi: 10.1097/PHM.0000000000001528 [DOI] [PMC free article] [PubMed] [Google Scholar]
- 13.Ufuk F, Demirci M, Sagtas E, Akbudak IH, Ugurlu E, Sari T. The prognostic value of pneumonia severity score and pectoralis muscle area on chest CT in adult COVID-19 patients. Eur J Radiol 2020;109271. doi: 10.1016/j.ejrad.2020.109271 [DOI] [PMC free article] [PubMed] [Google Scholar]
- 14.Kottlors J, Zopfs D, Fervers P, et al. Body composition on low dose chest CT is a significant predictor of poor clinical outcome in COVID-19 disease - A multicenter feasibility study. Eur J Radiol 2020;109274. doi: 10.1016/j.ejrad.2020.109274 [DOI] [PMC free article] [PubMed] [Google Scholar]
- 15.Rubin GD, Ryerson CJ, Haramati LB, et al. The Role of Chest Imaging in Patient Management during the COVID-19 Pandemic: A Multinational Consensus Statement from the Fleischner Society. Radiology 2020;172–180. doi: 10.1148/radiol.2020201365 [DOI] [PMC free article] [PubMed] [Google Scholar]
- 16.Sverzellati N, Milanese G, Milone F, Balbi M, Ledda RE, Silva M. Integrated Radiologic Algorithm for COVID-19 Pandemic. J Thorac Imaging 2020;228–233. doi: 10.1097/RTI.0000000000000516 [DOI] [PMC free article] [PubMed] [Google Scholar]
- 17.Bernheim A, Mei X, Huang M, et al. Chest CT Findings in Coronavirus Disease-19 (COVID-19): Relationship to Duration of Infection. Radiology 2020;685–691. doi: 10.1148/radiol.2020200463 [DOI] [PMC free article] [PubMed] [Google Scholar]
- 18.Falaschi Z, Danna PSC, Arioli R, et al. Chest CT accuracy in diagnosing COVID-19 during the peak of the Italian epidemic: A retrospective correlation with RT-PCR testing and analysis of discordant cases. Eur J Radiol 2020;109192. doi: 10.1016/j.ejrad.2020.109192 [DOI] [PMC free article] [PubMed] [Google Scholar]
- 19.Colombi D, Bodini FC, Petrini M, et al. Well-aerated Lung on Admitting Chest CT to Predict Adverse Outcome in COVID-19 Pneumonia. Radiology 2020;E86–E96. doi: 10.1148/radiol.2020201433 [DOI] [PMC free article] [PubMed] [Google Scholar]
- 20.Spagnolo P, Cozzi A, Foà RA, et al. CT-derived pulmonary vascular metrics and clinical outcome in COVID-19 patients. Quant Imaging Med Surg 2020;1325–1333. doi: 10.21037/qims-20-546 [DOI] [PMC free article] [PubMed] [Google Scholar]
- 21.Centers for Disease Control and Prevention . Evidence used to update the list of underlying medical conditions that increase a person’s risk of severe illness from COVID-19. 2020. https://www.cdc.gov/coronavirus/2019-ncov/need-extra-precautions/evidence-table.html. Accessed February 19, 2021. [PubMed] [Google Scholar]
- 22.Sardanelli F, Cozzi A, Monfardini L, et al. Association of mediastinal lymphadenopathy with COVID-19 prognosis. Lancet Infect Dis 2020;1230–1231. doi: 10.1016/S1473-3099(20)30521-1 [DOI] [PMC free article] [PubMed] [Google Scholar]
- 23.Nishimura JM, Ansari AZ, D’Souza DM, Moffatt-Bruce SD, Merritt RE, Kneuertz PJ. Computed Tomography-Assessed Skeletal Muscle Mass as a Predictor of Outcomes in Lung Cancer Surgery. Ann Thorac Surg 2019;1555–1564. doi: 10.1016/j.athoracsur.2019.04.090 [DOI] [PubMed] [Google Scholar]
- 24.Hua X, Deng J-P, Long Z-Q, et al. Prognostic significance of the skeletal muscle index and an inflammation biomarker in patients with breast cancer who underwent postoperative adjuvant radiotherapy. Curr Probl Cancer 2020;100513. doi: 10.1016/j.currproblcancer.2019.100513 [DOI] [PubMed] [Google Scholar]
- 25.Waduud MA, Sucharitkul PPJ, Drozd M, Gupta A, Hammond C, Ashbridge Scott DJ. Validation of two-dimensional vertebral body parameters in estimating patient height in elderly patients. Br J Radiol 2019;20190342. doi: 10.1259/bjr.20190342 [DOI] [PMC free article] [PubMed] [Google Scholar]
- 26.DeLong ER, DeLong DM, Clarke-Pearson DL. Comparing the areas under two or more correlated receiver operating characteristic curves: a nonparametric approach. Biometrics 1988;837–845. [PubMed] [Google Scholar]
- 27.Altmayer S, Zanon M, Pacini GS, et al. Comparison of the computed tomography findings in COVID-19 and other viral pneumonia in immunocompetent adults: a systematic review and meta-analysis. Eur Radiol 2020;6485–6496. doi: 10.1007/s00330-020-07018-x [DOI] [PMC free article] [PubMed] [Google Scholar]
- 28.Boreskie KF, Hay JL, Duhamel TA. Preventing Frailty Progression during the COVID-19 Pandemic. J Frailty Aging 2020;130–131. doi: 10.14283/jfa.2020.29 [DOI] [PMC free article] [PubMed] [Google Scholar]
- 29.Cesari M, Proietti M. COVID-19 in Italy: Ageism and Decision Making in a Pandemic. J Am Med Dir Assoc 2020;576–577. doi: 10.1016/j.jamda.2020.03.025 [DOI] [PMC free article] [PubMed] [Google Scholar]
- 30.Weijs PJ, Looijaard WG, Dekker IM, et al. Low skeletal muscle area is a risk factor for mortality in mechanically ventilated critically ill patients. Crit Care 2014;R12. doi: 10.1186/cc13189 [DOI] [PMC free article] [PubMed] [Google Scholar]
- 31.Looijaard WGPM, Dekker IM, Stapel SN, et al. Skeletal muscle quality as assessed by CT-derived skeletal muscle density is associated with 6-month mortality in mechanically ventilated critically ill patients. Crit Care 2016;386. doi: 10.1186/s13054-016-1563-3 [DOI] [PMC free article] [PubMed] [Google Scholar]
- 32.Elliott JE, Greising SM, Mantilla CB, Sieck GC. Functional impact of sarcopenia in respiratory muscles. Respir Physiol Neurobiol 2016;137–146. doi: 10.1016/j.resp.2015.10.001 [DOI] [PMC free article] [PubMed] [Google Scholar]
- 33.Mehta P, McAuley DF, Brown M, Sanchez E, Tattersall RS, Manson JJ. COVID-19: consider cytokine storm syndromes and immunosuppression. Lancet 2020;1033–1034. doi: 10.1016/S0140-6736(20)30628-0 [DOI] [PMC free article] [PubMed] [Google Scholar]
- 34.Li T, Zhang Y, Gong C, et al. Prevalence of malnutrition and analysis of related factors in elderly patients with COVID-19 in Wuhan, China. Eur J Clin Nutr 2020;871–875. doi: 10.1038/s41430-020-0642-3 [DOI] [PMC free article] [PubMed] [Google Scholar]
- 35.Burns JE, Yao J, Chalhoub D, Chen JJ, Summers RM. A Machine Learning Algorithm to Estimate Sarcopenia on Abdominal CT. Acad Radiol 2020;311–320. doi: 10.1016/j.acra.2019.03.011 [DOI] [PubMed] [Google Scholar]


