Figure 2.

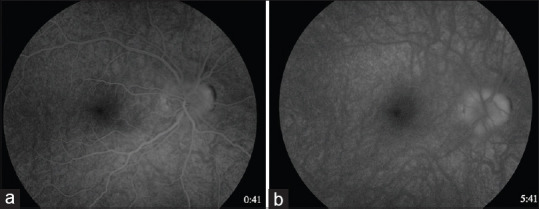
Intravenous fluorescein angiography in the right eye in early (left image; 41 s) and late phases (right image; 5 min and 41 s), showing late leakage most apparent at the superonasal margin of the optic disc, indicating disc edema

Intravenous fluorescein angiography in the right eye in early (left image; 41 s) and late phases (right image; 5 min and 41 s), showing late leakage most apparent at the superonasal margin of the optic disc, indicating disc edema