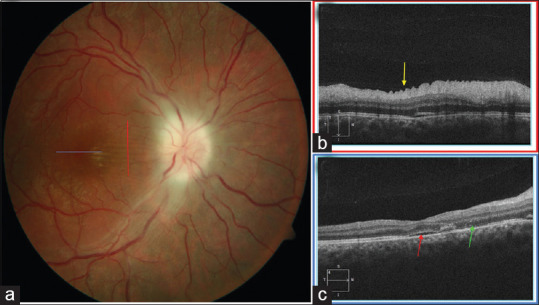
Figure 4.

Optic atrophy from papilledema. (a) Vertical raster optical coherence tomography scan (red line) highlights the (b) radial retinal folds (yellow arrow). (c) Horizontal raster optical coherence tomography scan through the fovea demonstrates mild subretinal fluid (red arrow) and dropout of the ellipsoid zone (green arrow)
