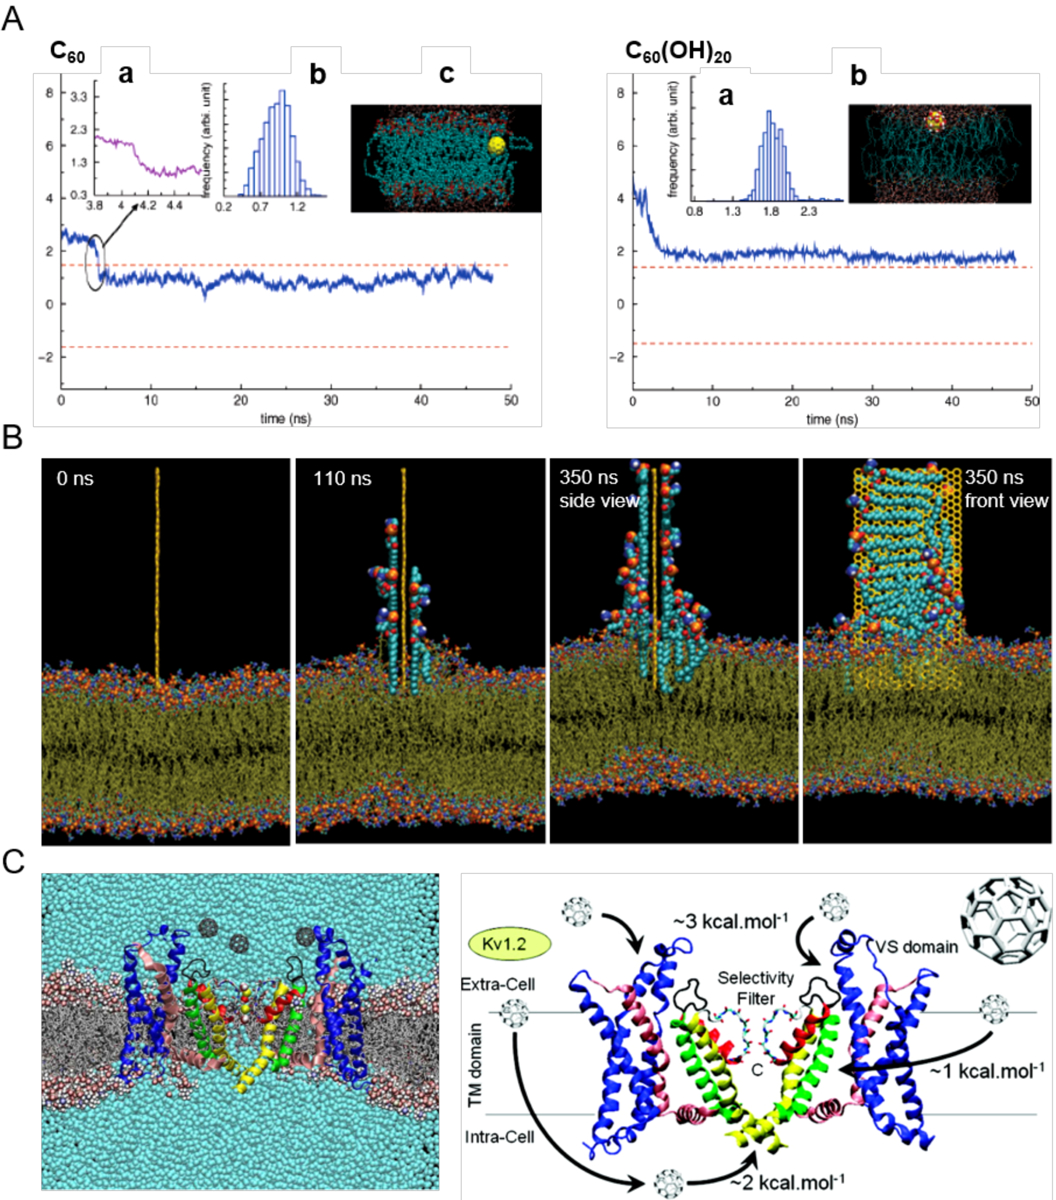
Figure 4. Nanoparticle-membrane interactions in silico.

(A) Uptake of C60 (left) and C60(OH)20 (right) in the transmembrane (z) direction. The two dashed lines denote the upper and lower leaflets of the DPPC bilayer. Top left panel: (a) Zoomed trajectory at t = 4.09 ns. (b) Center-of-mass (COM) of C60 after it enters the bilayer (t > 4.2 ns). (c) Side view of the simulation system at t = 34.5 ns. The yellow ball denotes the C60 particle, cyan dots denote the lipid tail groups, and the red and blue dots represent the lipid head groups. Top right panel: (a) COM of C60(OH)20 during simulation. (b) Side view of the simulation system. Yellow balls and the attached large red and white dots denote the C60(OH)20 particle, cyan dots denote the tail groups of the DPPC lipids, and the small red and blue dots denote the lipid head groups.[97] (B) Lipid extraction by graphene in docking simulations over time. The restrained graphene nanosheet was docked at the surface of the outer POPE membrane of E. coli.[100] (C) Affinity of C60 with membrane potassium channels. (Left) A Kv1.2 channel embedded in a POPC lipid bilayer in the presence of C60 nanoparticles and their associated energetics.[101] Panels reproduced from Refs. 97, 100, 101. Copyrights 2007 American Chemical Society, 2013 Springer Nature and 2010 American Chemical Society.
