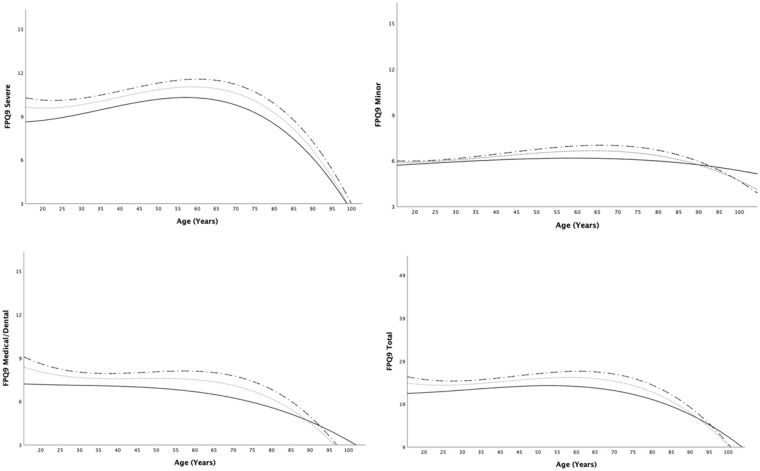
Figure 3.
Scatterplots for each of the three FPQ-9 subscales and the total FPQ-9 score to show cubic function results. In each scatterplot, the dashed black line indicates women, the solid black line indicates men, and the dashed gray line indicates the overall best-fitting line. FPQ-9 = Fear of Pain Questionnaire-9.

