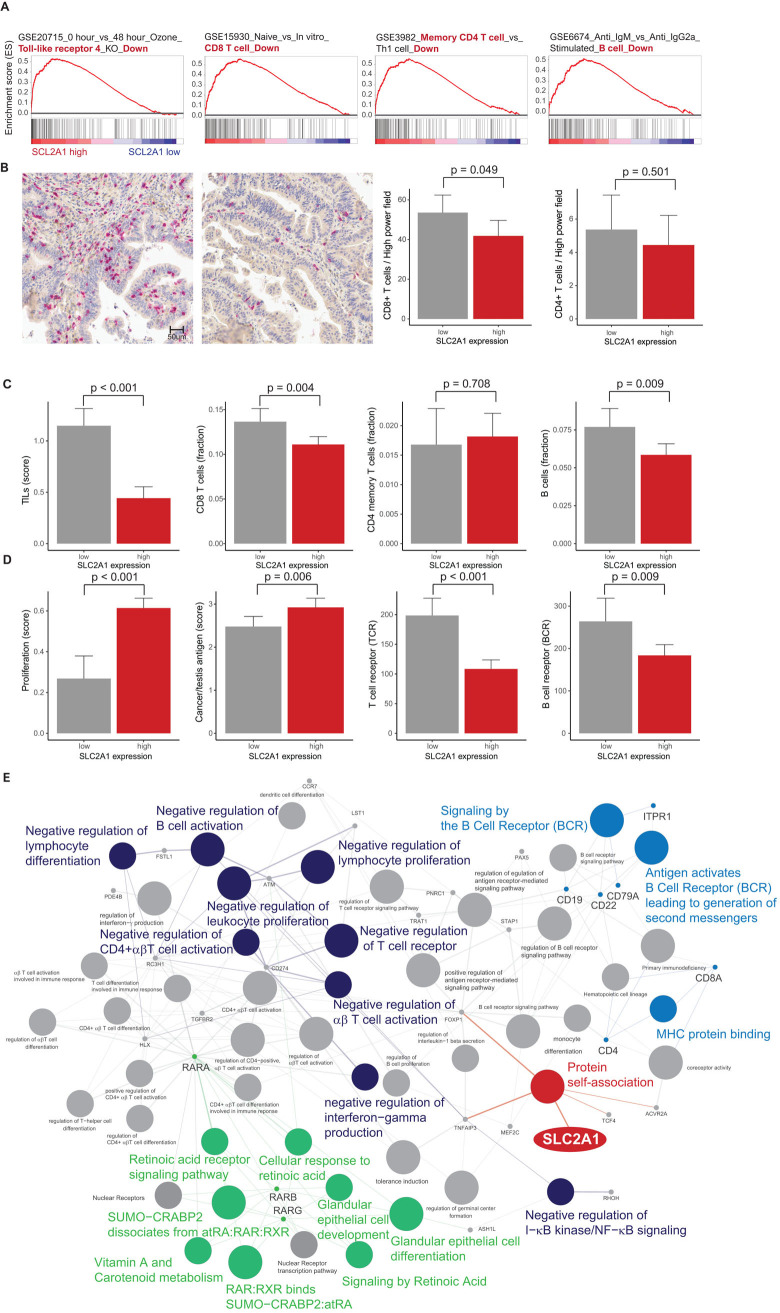
Fig 3.
(A) Gene set enrichment analysis (GSEA) of four SLC2A1-dependent immunologic gene sets: downregulation of toll-like receptor 4 (TLR-4) expression, CD8 T cells, memory CD4 T cells and B cells. (B) Representative microphotographs showing CD8 T cells (red): increased CD8 T cells and decreased CD8 T cells in low SLC2A1 expression (left) and high SLC2A1 expression (right), respectively. Bar plot of CD8 T cells (left) and CD4 T cells (right) per high-power field (p = 0.049 and 0.501, respectively) in our cohort. (C) Bar plot of tumor-infiltrating lymphocytes (TILs), CD8 T cells, CD4 memory T cells and B cells between samples with low (gray) and high (red) SLC2A1 expression (p = 0.001, 0.004, 0.708 and 0.009, respectively) in the TCGA database. (D) Bar plot of proliferation, cancer/testis antigen (CTA) expression, T cell receptor (TCR) expression and B cell receptor (BCR) expression between samples with low (gray) and high (red) SLC2A1 expression (p = 0.001, 0.006, 0.001 and 0.009, respectively) (error bars: standard errors of the mean). (E) Grouping of networks based on functionally enriched gene ontology (GO) terms and pathways: SLC2A1 (black) was indirectly associated with negative regulation of immune cells (red), immune receptors (blue) and retinoids (green).

